Statistical Concepts for Time Series Analysis
Topic outline
-
-
-
In the context of climate monitoring, time series analysis is important to help uncover insights into long-term climate changes, identify recurring patterns, detect trends, and forecast future climate conditions.
Definition
A time series is a sequence of data points measured at successive time intervals. In climate monitoring, these data points represent various meteorological variables such as temperature, precipitation, humidity, wind speed, and sea level, among others. Time series analysis involves examining these data points over time to uncover underlying patterns, trends, and anomalies.
Practical Applications
Time series provides insights into the dynamics of climate variables over time. By understanding past trends and patterns, we can make more accurate predictions about future climatic conditions. There are several different practical applications for time series analysis.
First, time series analysis helps identify long-term trends in climate variables, such as increasing temperatures or changing precipitation patterns. Understanding these trends can help assess the impacts of climate change and inform adaptation strategies.
Climate data exhibits seasonal variations due to natural cycles throughout the year. Time series analysis allows us to account for these seasonal patterns. This is important to help predict seasonal climate phenomena such as monsoons, hurricanes, and droughts. In addition, it is important to be able to detect long term trends over the course of the whole season between one year and another.
Finally, time series analysis can detect anomalies or outliers in climate data, which may indicate extreme weather events or abnormal climate conditions. Identifying anomalies can help assess climate risks and help develop early warning systems for natural disasters.
Example
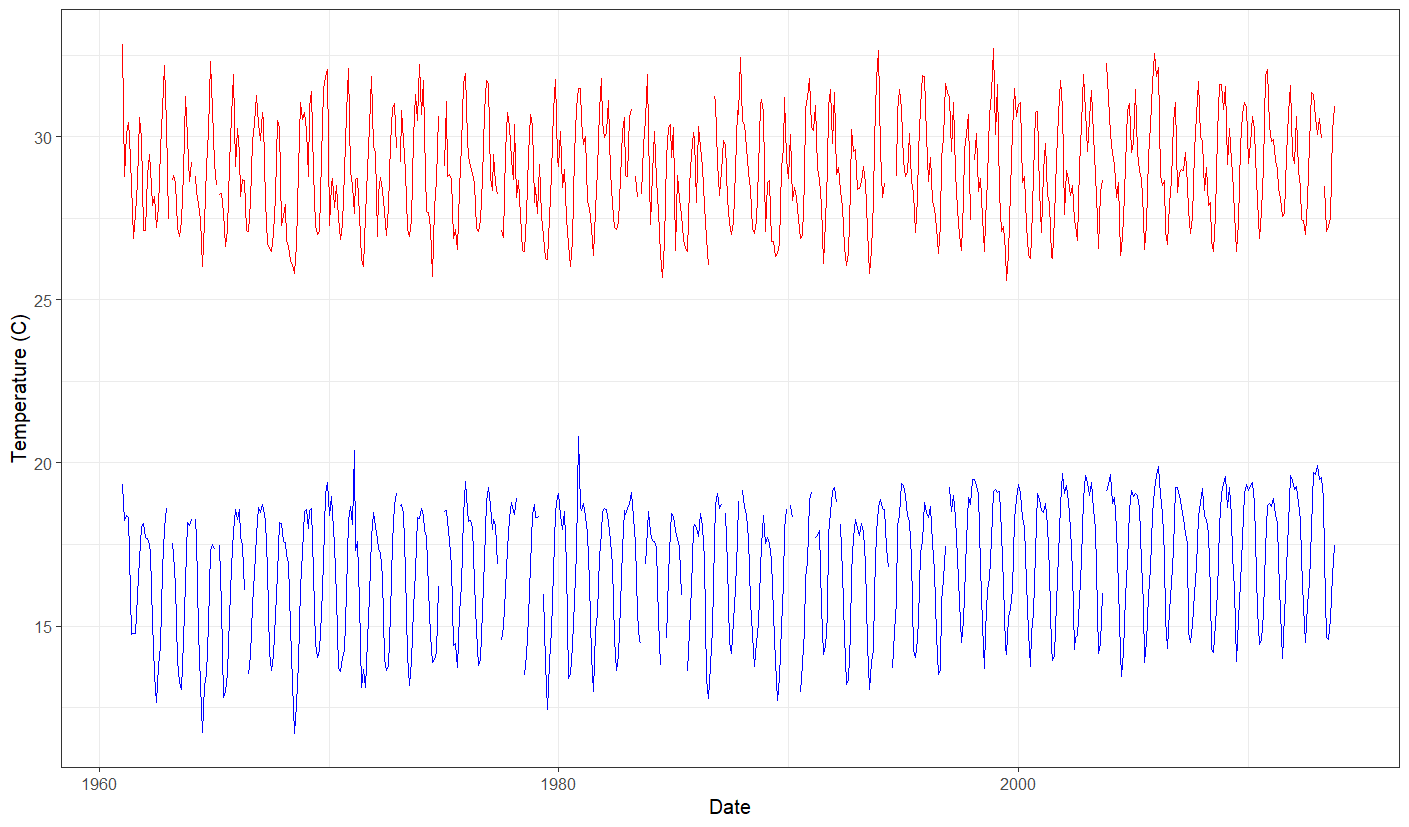
The following graph is an example of time series data. This shows the average (mean) temperature for each month and year in Dodoma in Tanzania from 1960 to 2013. There are two lines on the graph: The top set display the average maximum temperature, and the bottom set displays the average minimum temperature.
In this, we can see the cyclical trends within a year. We can also see that over the years, there is generally an upwards trend of the minimum temperature from 1960 to 2013.
-
Page
-
-
-