Statistical Concepts for Time Series Analysis
Topic outline
-
-
In this section, we aim to clarify the concept of percentiles and their relation to summary statistics such as the median and quartiles.
Definition
Percentiles are a statistical concept used to understand the distribution of a dataset. They help us grasp how individual data points compare to the rest of the data. Percentiles help describe the proportion of values that are less than or equal to a specified value of interest.
A
pthpercentile represents a value, for examplex, whereppercent of the values are less than or equal tox. For instance, the 50th percentile, commonly known as the median, is the value that divides a dataset into two equal halves.
Illustrative Examples
Percentiles can be visualised on a cumulative distribution graph or using a boxplot
Cumulative Distribution
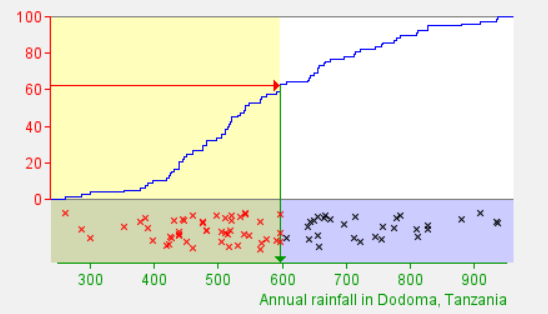
The graph below displays the cumulative distribution of annual rainfall for Dodoma, Tanzania. On the vertical axis, we represent the percentiles, while the horizontal axis displays the values of annual rainfall. For instance, the green vertical line indicates that the 62nd percentile value is approximately 600mm.
Quartiles and Boxplots
Quartiles divide the dataset into four equal parts.
- The lower quartile (25th percentile) represents the value below which 25% of the data falls.
- The upper quartile (75th percentile) represents the value below which 75% of the data falls.
- The median is the 50th percentile.
These quartiles can be displayed using a boxplot to help understand the distribution of data.
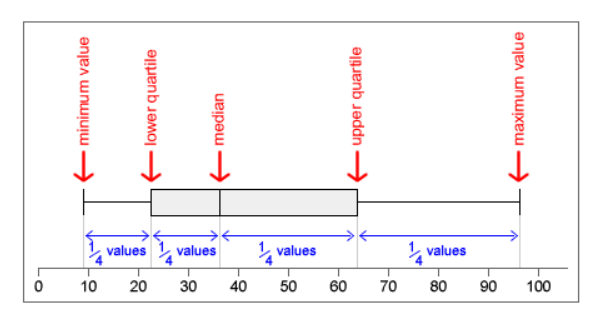
A symmetrical distribution is indicated when the distances from the minimum to the first quartile and median are similar to those from the median to the upper quartile and maximum. Conversely, if the distances vary significantly, the distribution is skewed.
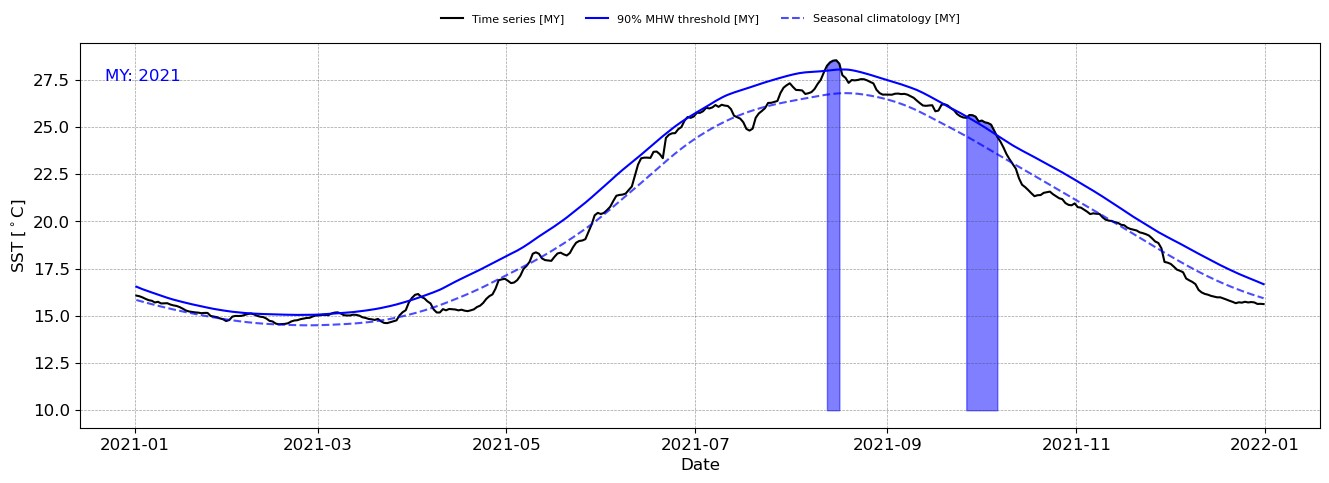
Rolling Percentiles
When percentiles are calculated for different data periods, we refer to them as rolling percentiles. It is important to define the period over which these percentiles are computed.
For example, in analysing marine heat waves, the 90th percentile of sea surface temperatures serves as the threshold for identifying heat wave events. Due to seasonal variations, a rolling percentile is used to identify heat wave events as shown below.
You can check your understanding of this lesson in the following quiz:

Quiz: Estimating Percentiles and Quartiles
-