Statistical Concepts for Time Series Analysis
Topic outline
-
-
-
P-values, short for "probability values," are statistical measures used to assess how strongly the evidence contradicts a null hypothesis.
Distribution of P-Values
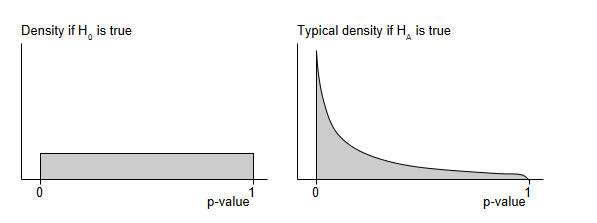
P-values are obtained from random samples, so they follow a certain pattern of distribution.
When the null hypothesis is true, all p-values between 0 and 1 are equally probable.
However, if there's an actual difference (alternative hypothesis), p-values tend to be closer to 0 rather than 1.
Interpreting P-Values
P-values are often misinterpreted. When we see a "significant" result, it means that our sample size in the model is big enough to give us confidence that the differences we've observed are not just happening by chance.
P-values are interpreted consistently across different tests.
Small P-Values:
A P-value less than a predefined significance level (often set at 0.05) indicates strong evidence against the null hypothesis. This means that the observed results are unlikely due to random chance alone, leading to rejection of the null hypothesis.
Large P-Values:
A P-value greater than the significance level suggests weak evidence against the null hypothesis. In such cases, there isn't enough evidence to reject the null hypothesis.
Here's a breakdown of interpretations based on P-value ranges:
-
P-value over 0.1: No convincing evidence against the null hypothesis.
-
P-value between 0.05 and 0.1: Very weak evidence against the null hypothesis.
-
P-value between 0.01 and 0.05: Moderately strong evidence against the null hypothesis.
-
P-value under 0.01: Strong evidence against the null hypothesis.
Examples
P-value = 0.0023
Interpretation: With such a small p-value, there's only a 0.0023 probability of obtaining these results if the null hypothesis were true. This suggests strong evidence against the null hypothesis.
P-value = 0.4
Interpretation: A p-value of 0.4 indicates a 40% chance of observing such results if the null hypothesis were true. Thus, there's no substantial evidence against the null hypothesis.
-
-
-
-
Below are several resources that aim to illustrate how changing the sample size impacts the p-value. First is a GIF of simulated data to demonstrate how increasing the sample size tends to result in a smaller p-value. There is then a set of slides on sample size, and finally a link to a page to experiment yourself.
Here, two distributions are randomly generated to follow a normal distribution. The sample size is increasing, and given under the "Sample Size" label at the top.
- Group 1 is normally generated to have a mean of 0
- Group 2 is normally generated to have a mean of 0.5.
A hypothesis test is then performed to test for a difference in means between the two distributions. We know since we have generated this data that there is a difference in the mean between the two distributions (Group 1 has a population mean of 0, Group 2 of 0.5). The P-Value from this hypothesis test is given under the "P-value" label.
If P-value is less than 0.5, then there is evidence that the sample size is large enough to show a difference in the means between our two groups.
We then have two plots. The first plot shows the distribution of values for two groups. Each group is represented by a bell curve. As you increase the sample size, the curves become more defined, allowing us to make more precise comparisons between the two groups.
The second plot displays a scatter plot giving the relationship between sample size and the p-value. As the sample size increases, the p-value tends to decrease, indicating stronger evidence that there is a difference in means between the two groups. This plot helps us understand how sample size affects the reliability of our statistical tests.
There are a set of slides given below. These contain additional information on how changing the sample size impacts the study.

Resources: Changing the Sample Size
After going through those slides, you may want to explore how p-values change with sample size for yourself. The following resource takes you to a page to test out for yourself with some data.
Xis randomly generated from a Normal distribution with mean 0, standard deviation 1. You can change the parameters forY. A hypothesis test (t-test) is performed to test whether the mean ofXis equivalent toY. This is repeated for the specified sample sizes you give. The resulting p-values are plotted against the sample size to see how the p-values are impacted by the changing sample size.
Link: Sample Size
-