Module 1. Cloud Structure in Satellite Images.
|
|
|
|
|
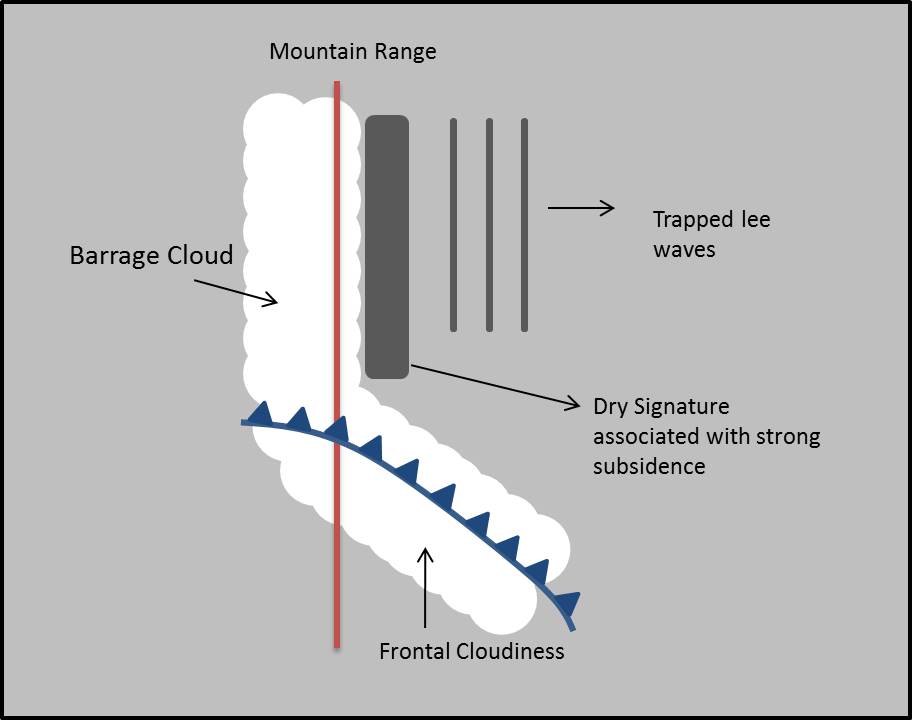
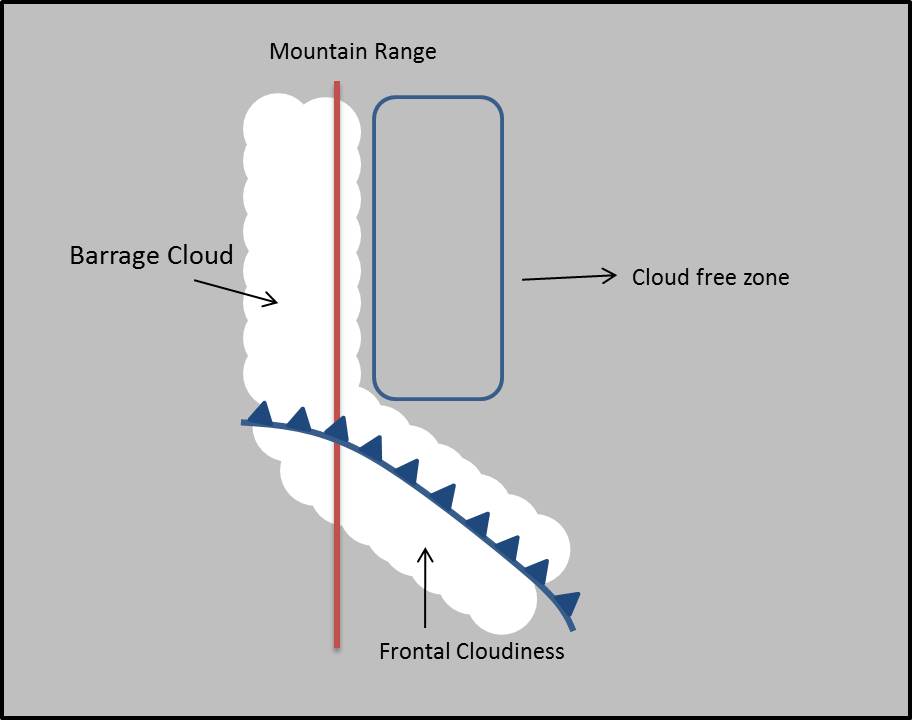
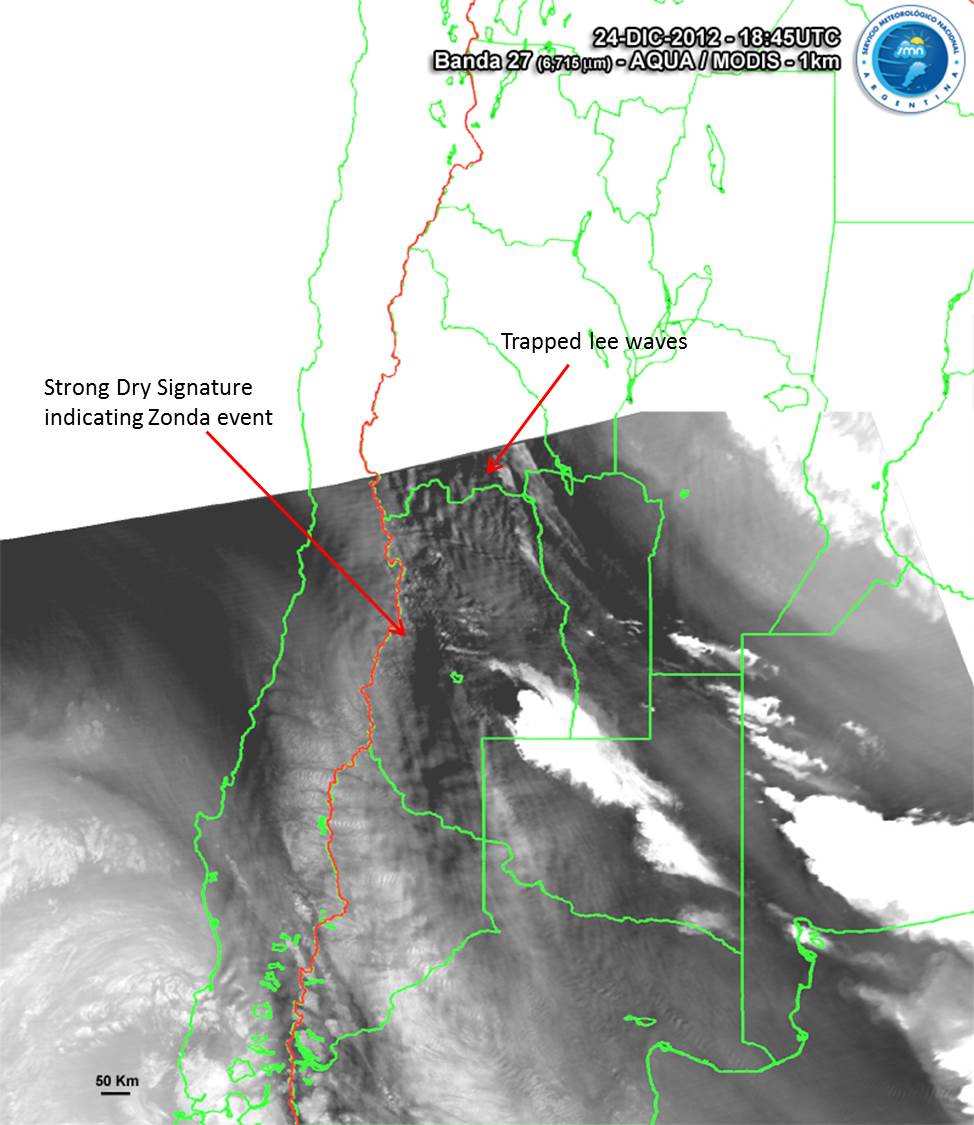
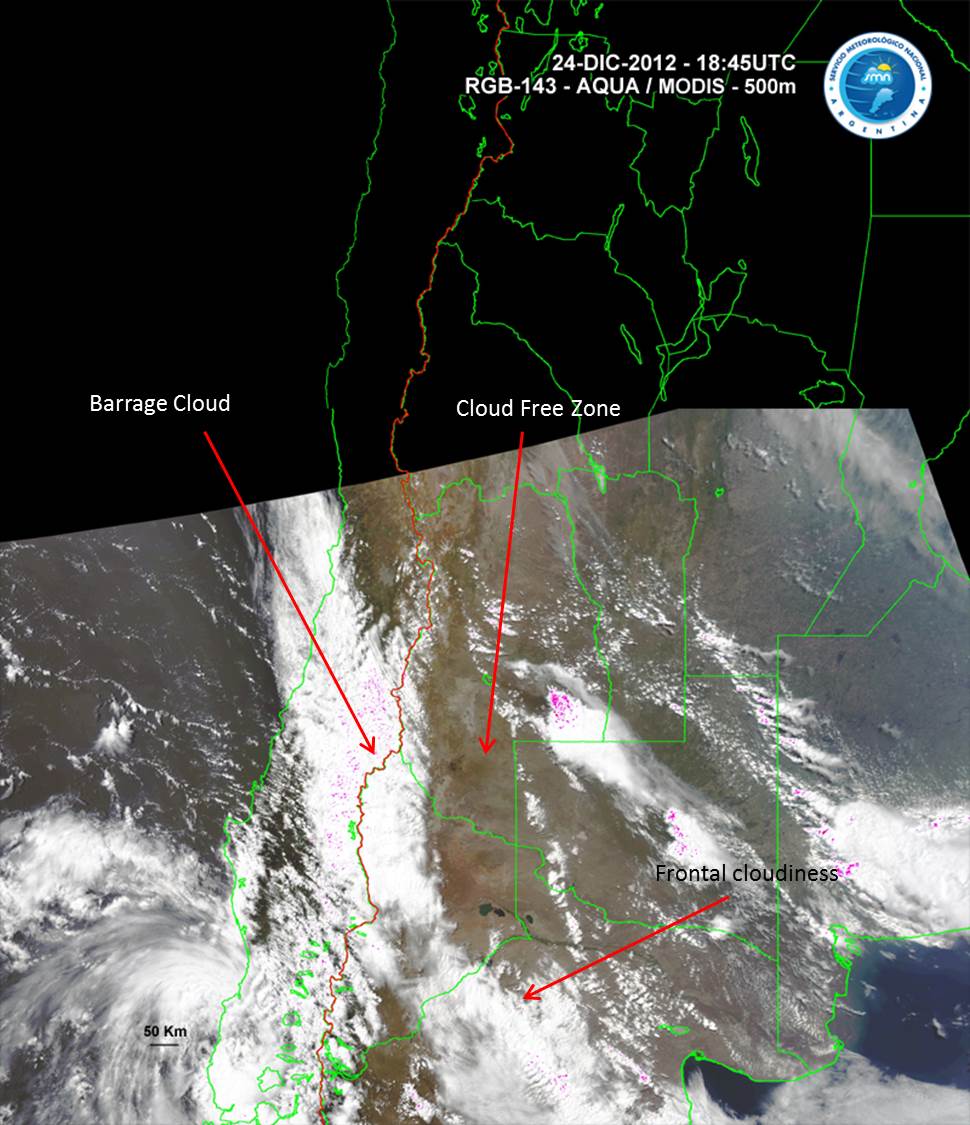
Questions- Can you detect the dry signature? (cloudiness over the mountains and windward slopes and a very dry zone on the lee side)
- Are there any trapped lee waves? Are they visible or not?
- Is there evidence of dust in suspension?
- When does the event start/end?
- Is there a sudden development?
- Which is the area affected by Zonda?
- How is the front advancing?