What is a gridded dataset and how to create it?
الخطوط العريضة للقسم
-
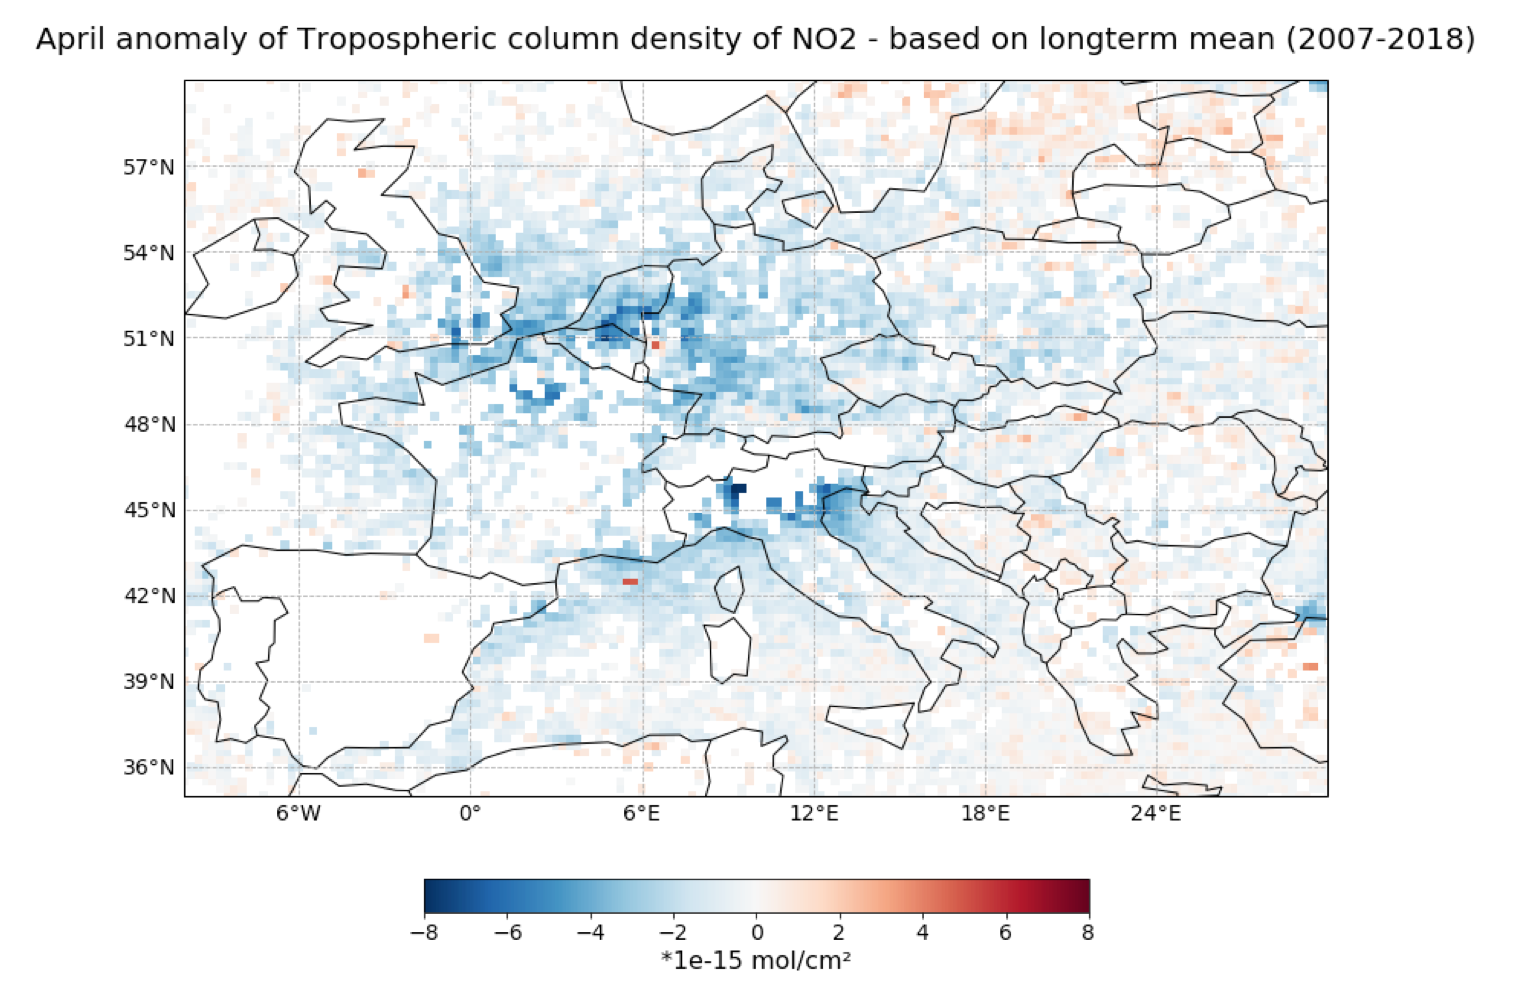
A case study on pollutants before and after the COVID-19 lockdown with the GOME-2 instrument
with Alessandra Cacciari, Julia Wagemann, Federico Fierli

Download, plot and explore GOME-2 Level 2 data, build a gridded (Level-3) dataset of Europe and run basic statistics using Jupyter Notebooks. The activity consists of a live webinar, a self-paced learning period and a live feedback session.
The short course consists of two parts:
- 9 December 2020, 12:00 UTC (13:00 CET) | Live webinar including a practical hands-on session. Join the session at the following Zoom link: https://eumetsat.zoom.us/meeting/register/tJwpduGurTooH9YlYtGGZMuHIKqdEBoWPuuJ ;
- 14 December 2020, 12:30 UTC (13:30 CET) | Live feedback session. Join the session at the following Zoom link: https://eumetsat.zoom.us/j/97064566586?pwd=Ulhrdk5Gb3FUVkNTRy8vVCsyejZOQT09 ;
The short course on 9 December gives you an introduction to the topic and the practical training material. Between the short course and the feedback session, you can work with the data in a self-paced manner. During the feedback session, we will discuss open questions and feedback.
You can engage and ask questions via Slido.com: #EUMSC8
Start familiarising yourself with the data and practical training material ahead of the short course.
See the section 'Jupyterhub and practical training material' on how to get access .
- 9 December 2020, 12:00 UTC (13:00 CET) | Live webinar including a practical hands-on session. Join the session at the following Zoom link: https://eumetsat.zoom.us/meeting/register/tJwpduGurTooH9YlYtGGZMuHIKqdEBoWPuuJ ;
