المساق: Using Copernicus Atmospheric Composition data: Satellite Data for Atmospheric Applications، Section: 2. Discover the data: TROPOMI Onboard Sentinel 5P | EUMETSAT

الصفحة الرئيسية للمساق الدراسي
  • عام

    LogoEGU2020

    logo

    This short course is part of the 2020 EGU General Assembly (SC1.21), it is an opportunity to learn about Copernicus data for Atmospheric Composition and get examples of how to develop your own workflows based on sample applications. 

    Webinar - 26 May at 10:30 CEST  (slide deck of the webinar available here in the presentations folder)

    • 10' Introduction and quick Slido polling session on topics for the hands-on session.
    • 20' The data (ESA, CAMS, EUMETSAT).
    • 30' Hands-on examples based on participants feedback gathered with Slido (Julia Wagemann, MEEO).


    The sessions will be hands-on and supported by Earth Observation and Model experts to discover data, handle them and produce plots out of a sample of the Copernicus data. You will make use of a series of freely available tools specifically developed for these applications, including Jupyter Notebook modules, to have an easy and intuitive way to make use of Python programming.
    No experience is necessary as various exercises will be provided for a wide range of skill levels and applications.
    It is recommended to join via laptop.

    Note: Slido will accompany the webinar session to collect your comments and answer your questions. The slido event will also stay open for the entire week (26-29 May) to support you during your individual data discovery.

    (3) Discover the data yourself and pick your dataset to play with

    A self-paced activity to start after the webinar until May 29th. You will receive support on slido with your questions.

    (4) 29 May, at 10:30 CEST. Sharing results, feedback and course evaluation (zoom link provided via email to registered participants)

    A final interactive sessions to discuss results, difficulties and provide us with your feedback.


    Few additional info:

    The European Union Copernicus programme is open and free for everyone - whether from academic, government, or commercial backgrounds. The programme has an operational focus, with satellite constellations and services. 

    Satellite data provides vital information on key atmospheric constituents, at different spatial and temporal scales, with continuous improvements in observational spatial and temporal resolution, coverage and measured species as well as a constantly evolving added value products from the Copernicus Atmospheric Monitoring Services.

2. Discover the data: TROPOMI Onboard Sentinel 5P

  • 2. Discover the data: TROPOMI Onboard Sentinel 5P

    This section provides you with an overview of Sentinel 5P - how you may access the data. In this course we will focus on Absorbing Aerosol Index (AAI) and CO TROPOMI S5P data. However, also other TROPOMI parameters, such as NO2 and HCHO can be accessed  and visualised using the instructions below. 


    • Sources for browsing S5P images without downloading the data

       
      Sentinel Hub EO Browser
       

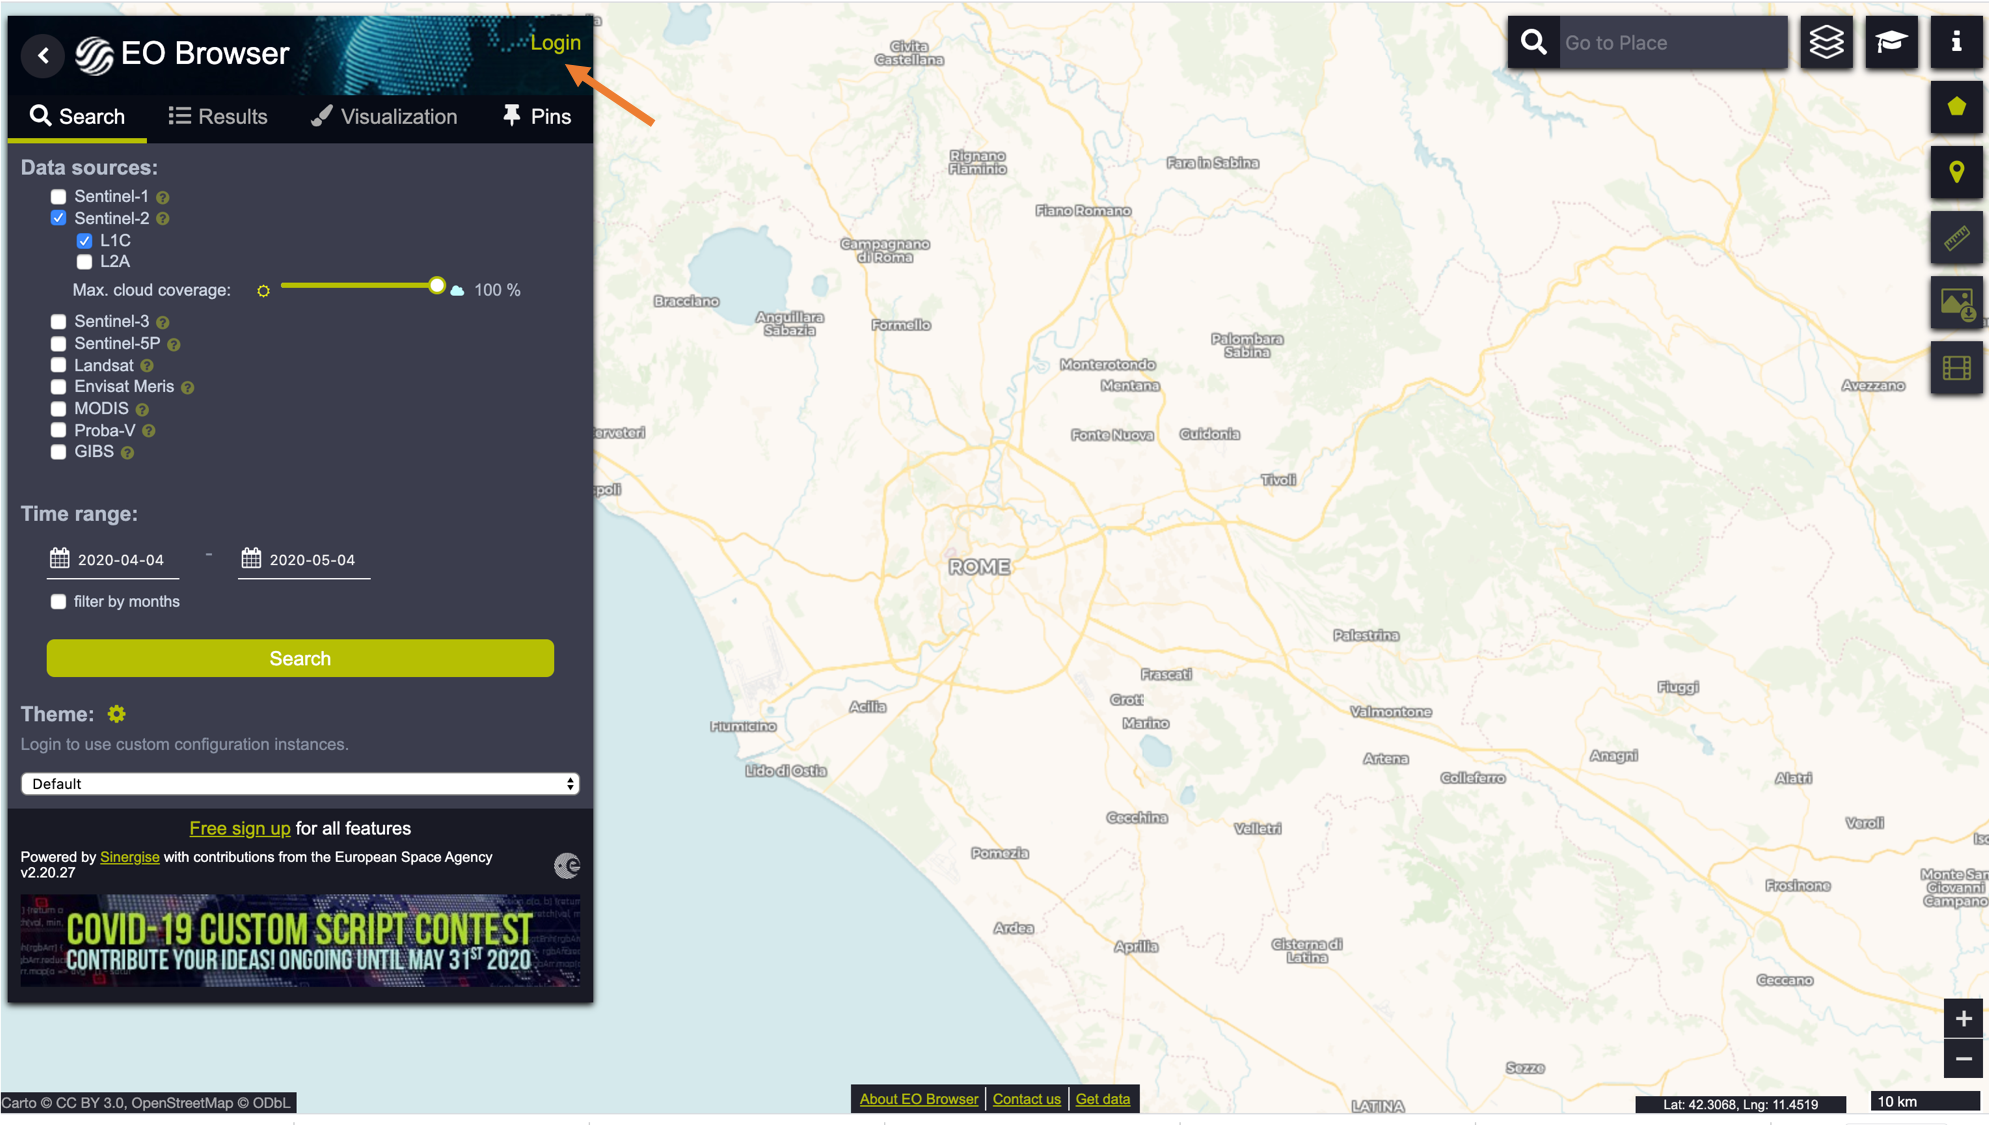
      1. With  Sentinel Hub EO Browser you can quickly visualize different Sentinel data, including Sentinel 5P. Registration (which is free) is needed to be able to use all options in the EO browser. Registration can be done by selecting first "Login" from the Hub web page, and then "Sign Up" in the new pop-up window.
      EO Browser 1

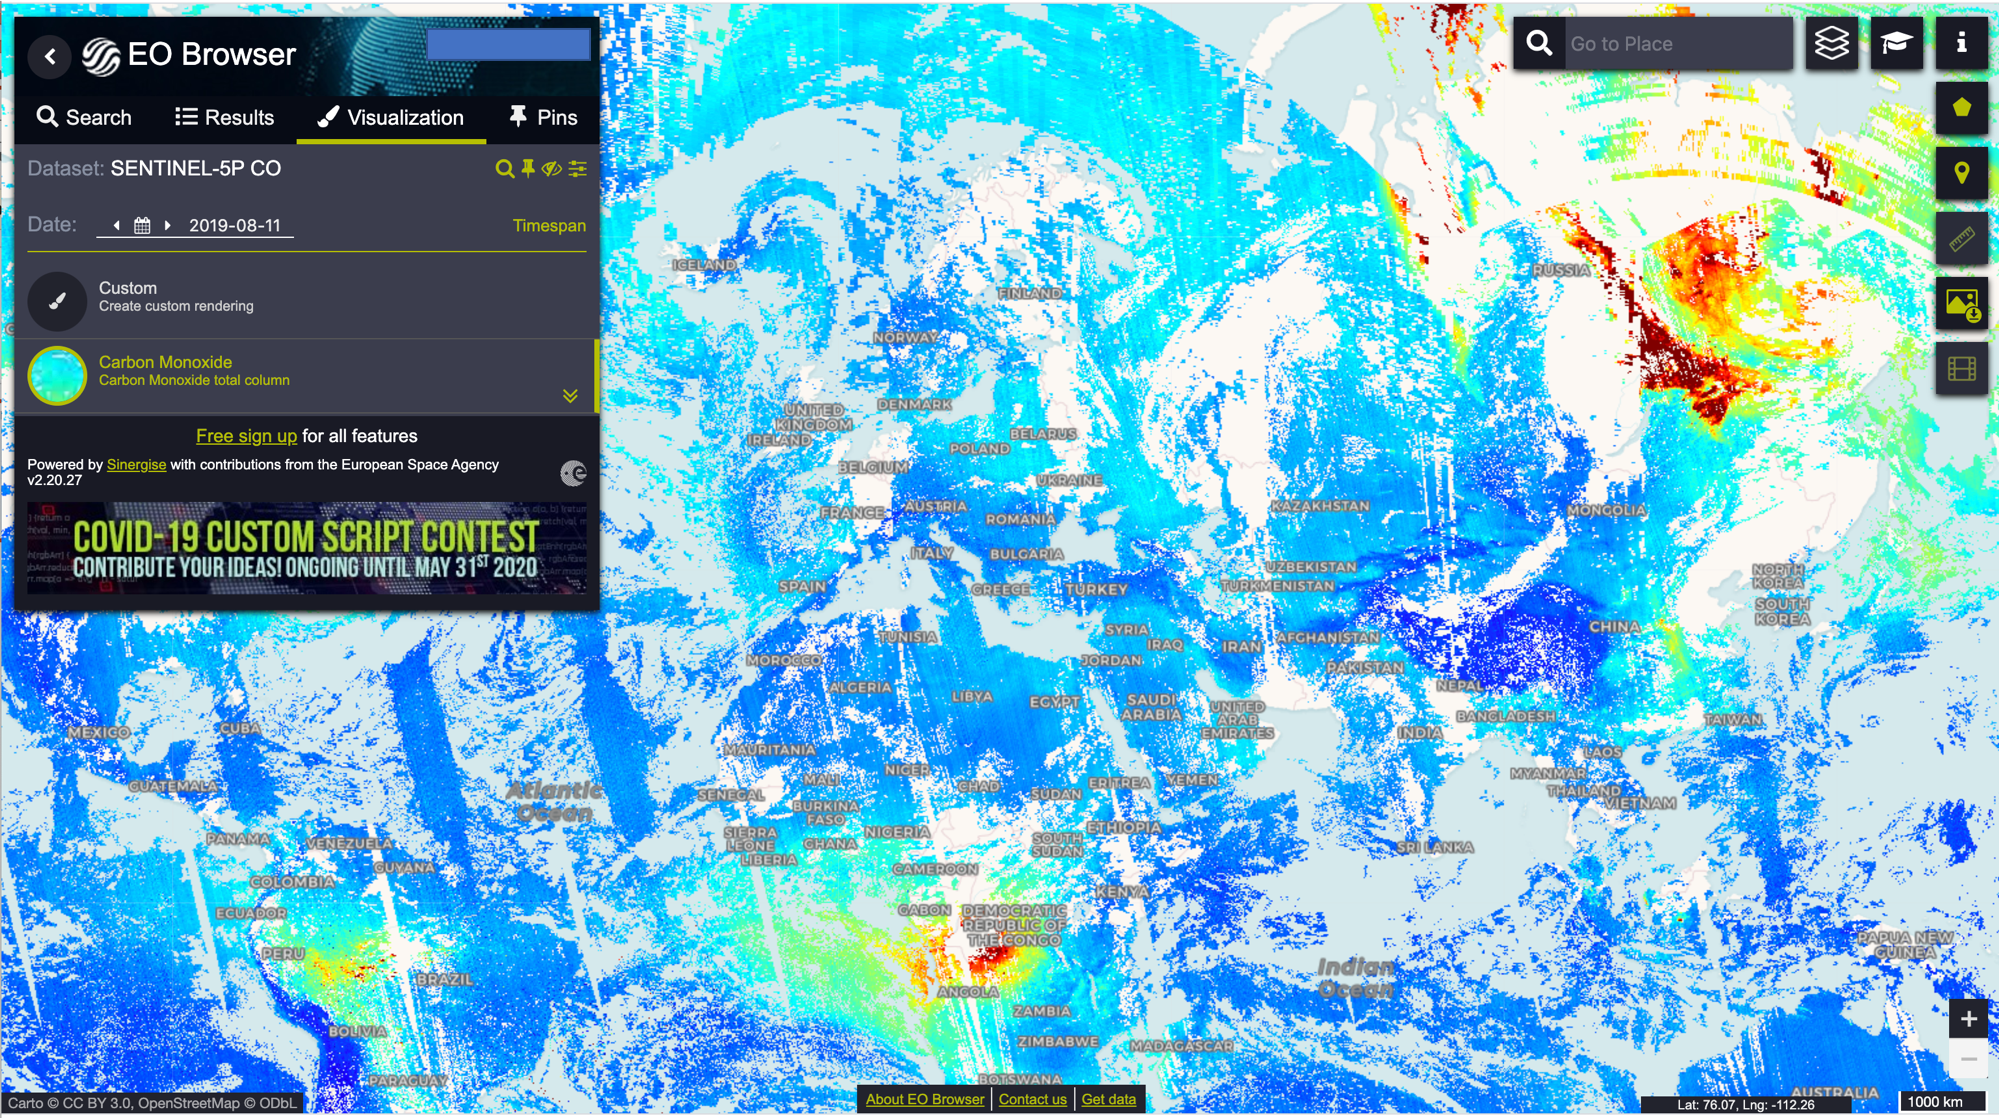
      2. After login, by checking the box "Sentinel 5P" (you might uncheck the other boxes) a list of Sentinel 5P parameters appear that you can visualize. By selecting the time period from the calendar you can browse the images.

      EO Browser 2, CO example

      3. More info on EO Browser and its functionalities can be found here.

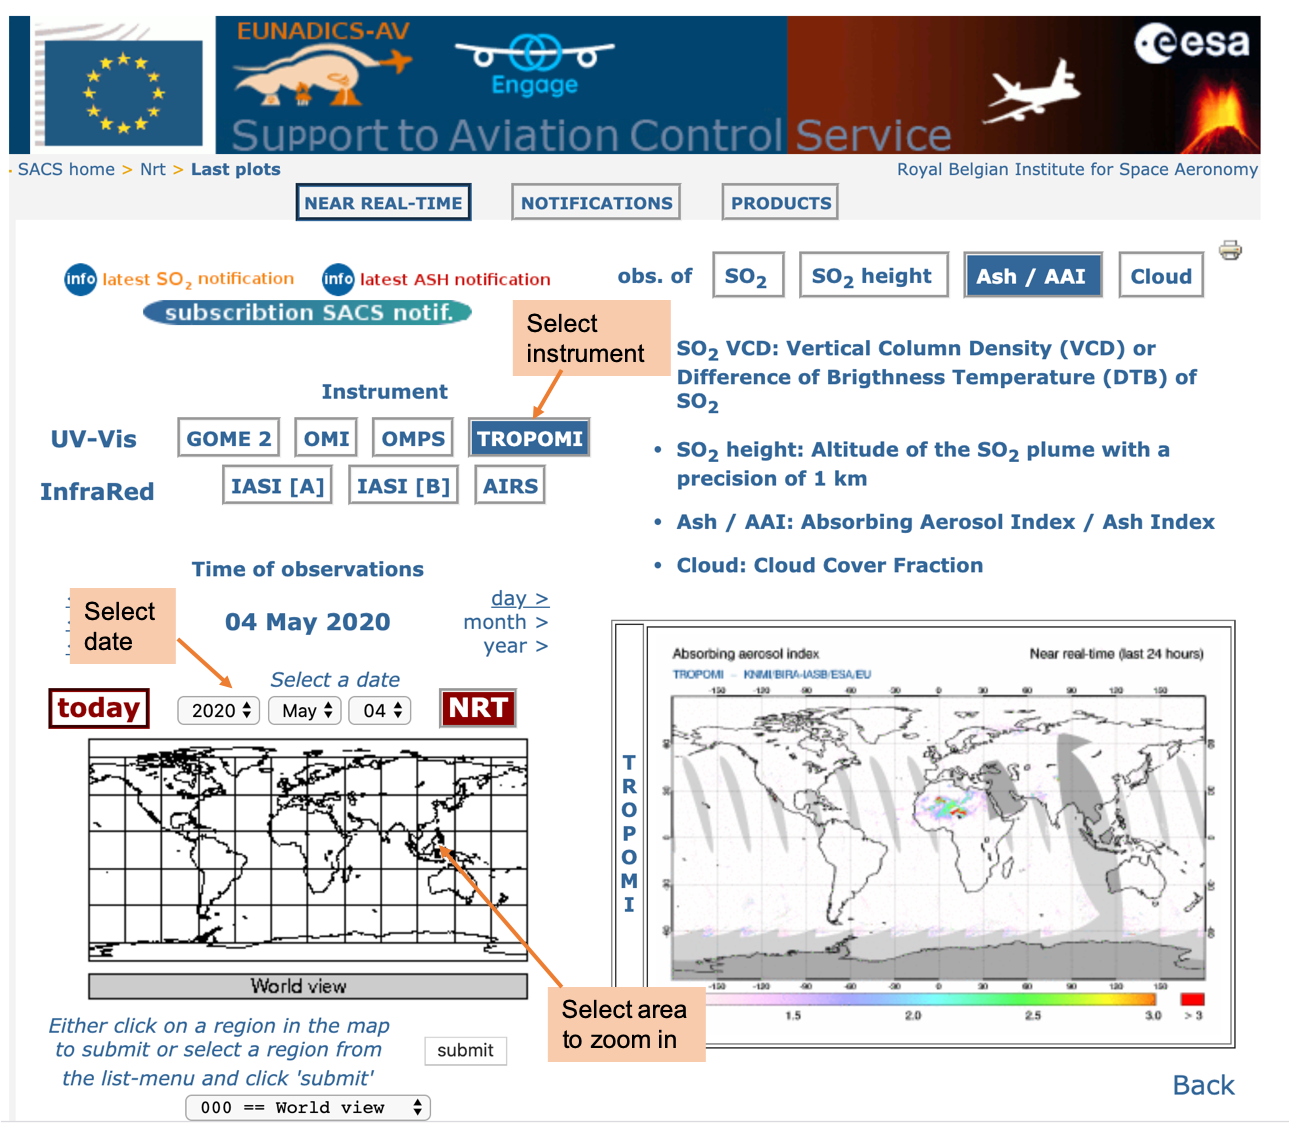
      Near Real Time and Archived Absorbing Aerosol Index from SACS

      The Support to Aviation Control Service (SACS) focuses on the timely delivery of SO2 and aerosol data derived from different satellite instruments to assess possible impact of volcanic eruptions on air traffic control and public safety. Even though the focus of the service is on volcanic eruptions, Absorbing Aerosol Index maps can give useful information on smoke emissions and transport from fires as well. In SACS AAI is available from several different instruments, including TROPOMI. 

      SACS

      From SACS service you can get the AAI maps from
      1. "Today", which shows the AAI observations from today only
      2. "NRT", which shows the AAI from the past 24 hours, i.e. it is a composite of  observations from today and yesterday.  
      3. "Archive", which shows observations for a specific day that you can select from the calendar.