Cours : Using Copernicus Atmospheric Composition data: Satellite Data for Atmospheric Applications | EUMETSAT

  • Général

    LogoEGU2020

    logo

    This short course is part of the 2020 EGU General Assembly (SC1.21), it is an opportunity to learn about Copernicus data for Atmospheric Composition and get examples of how to develop your own workflows based on sample applications. 

    Webinar - 26 May at 10:30 CEST  (slide deck of the webinar available here in the presentations folder)

    • 10' Introduction and quick Slido polling session on topics for the hands-on session.
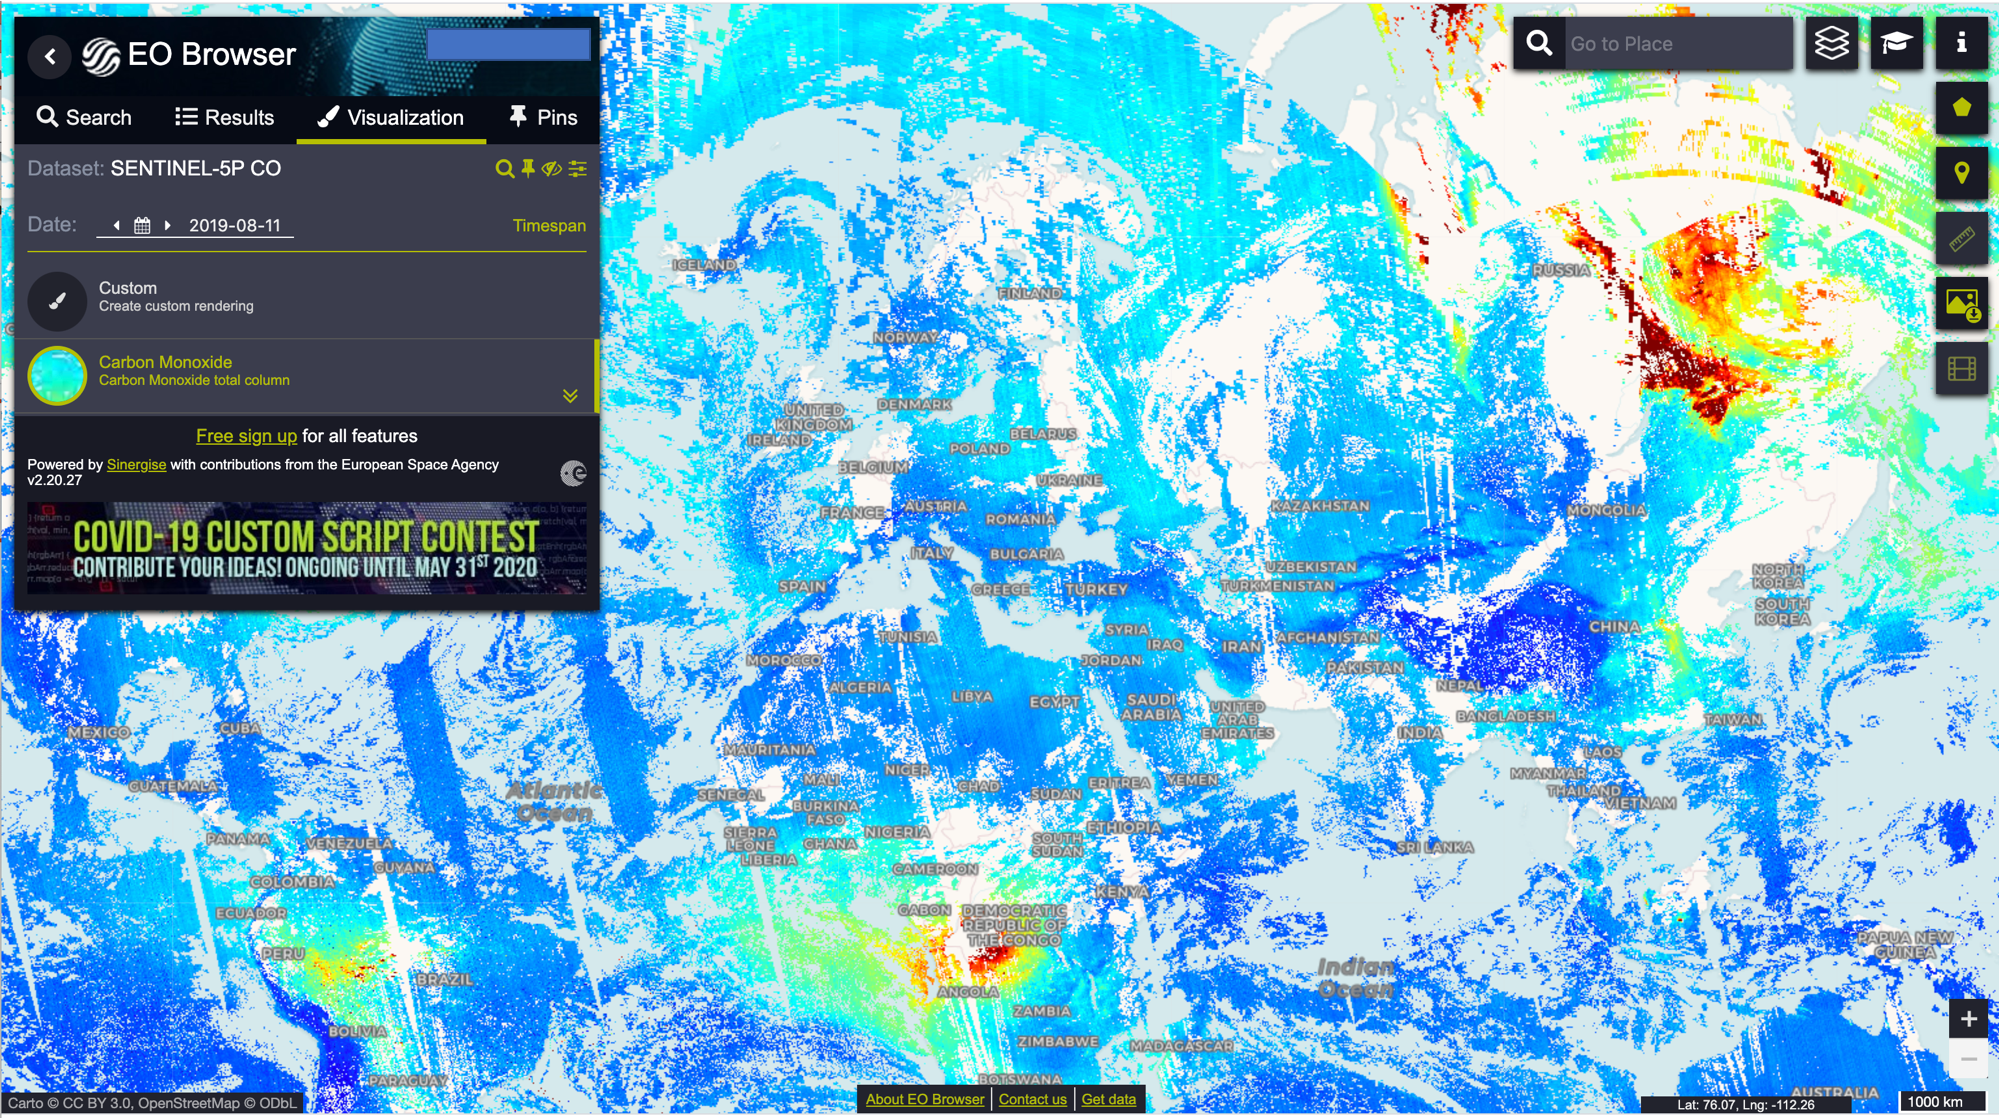
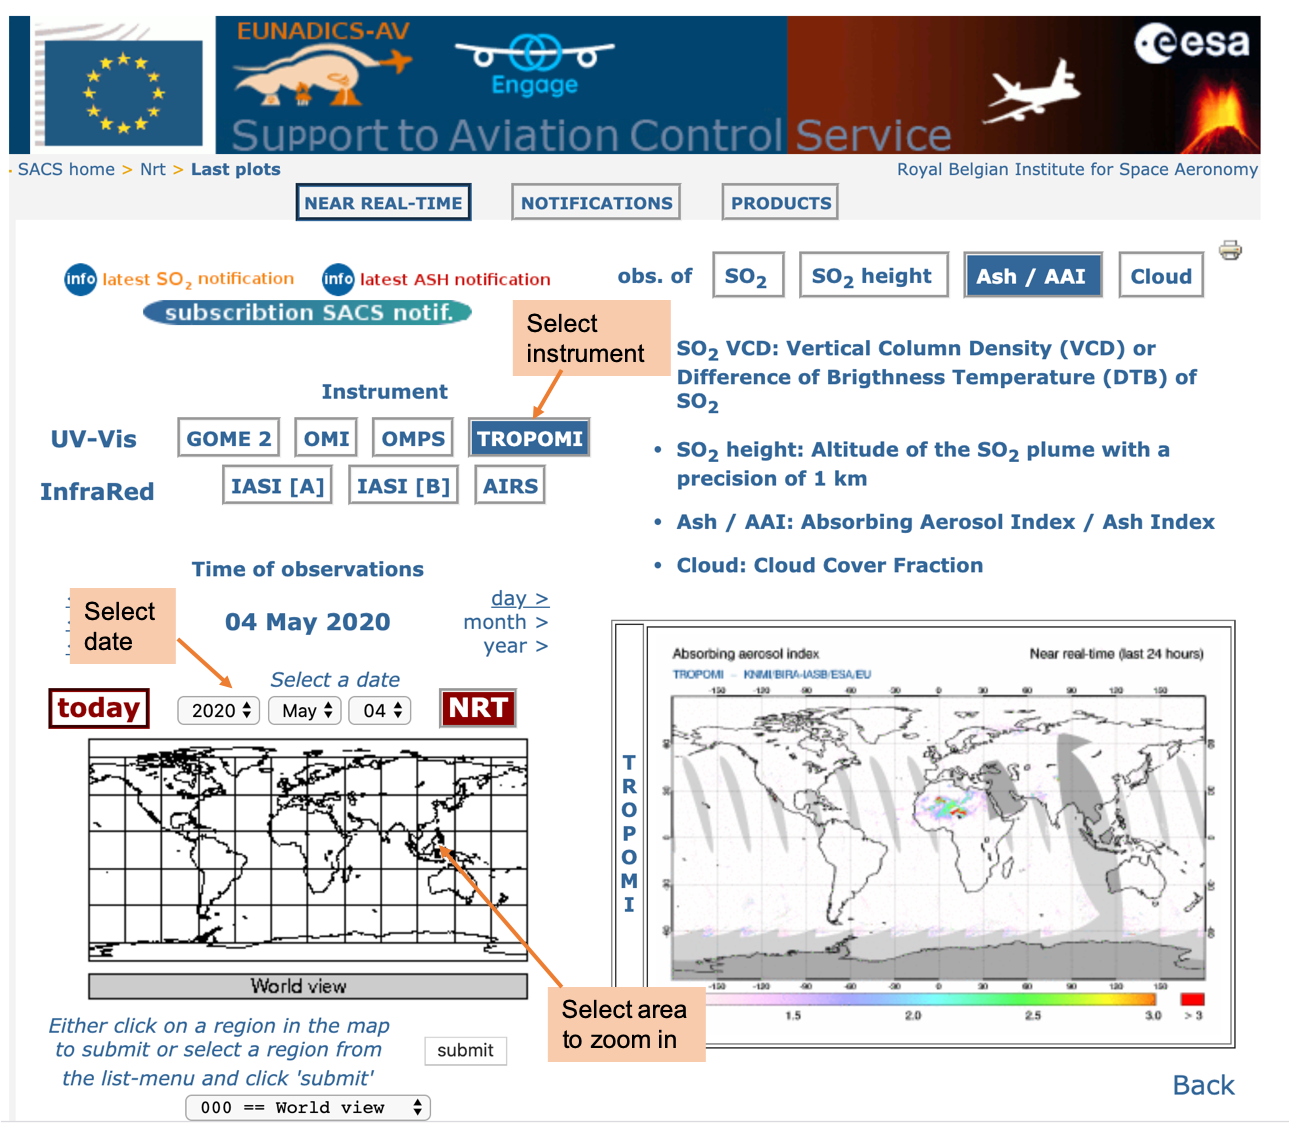
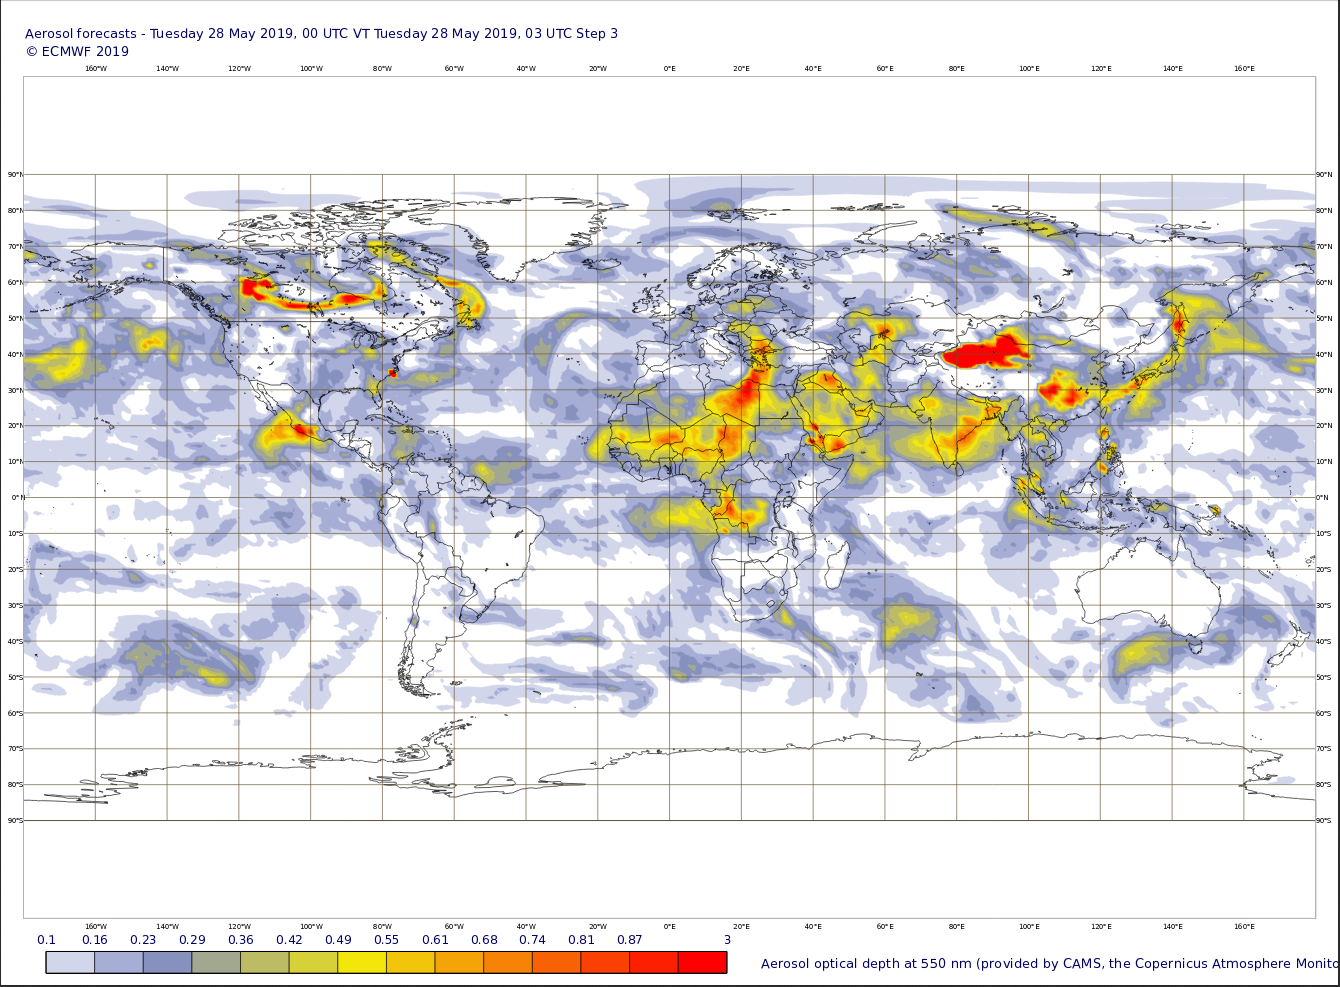
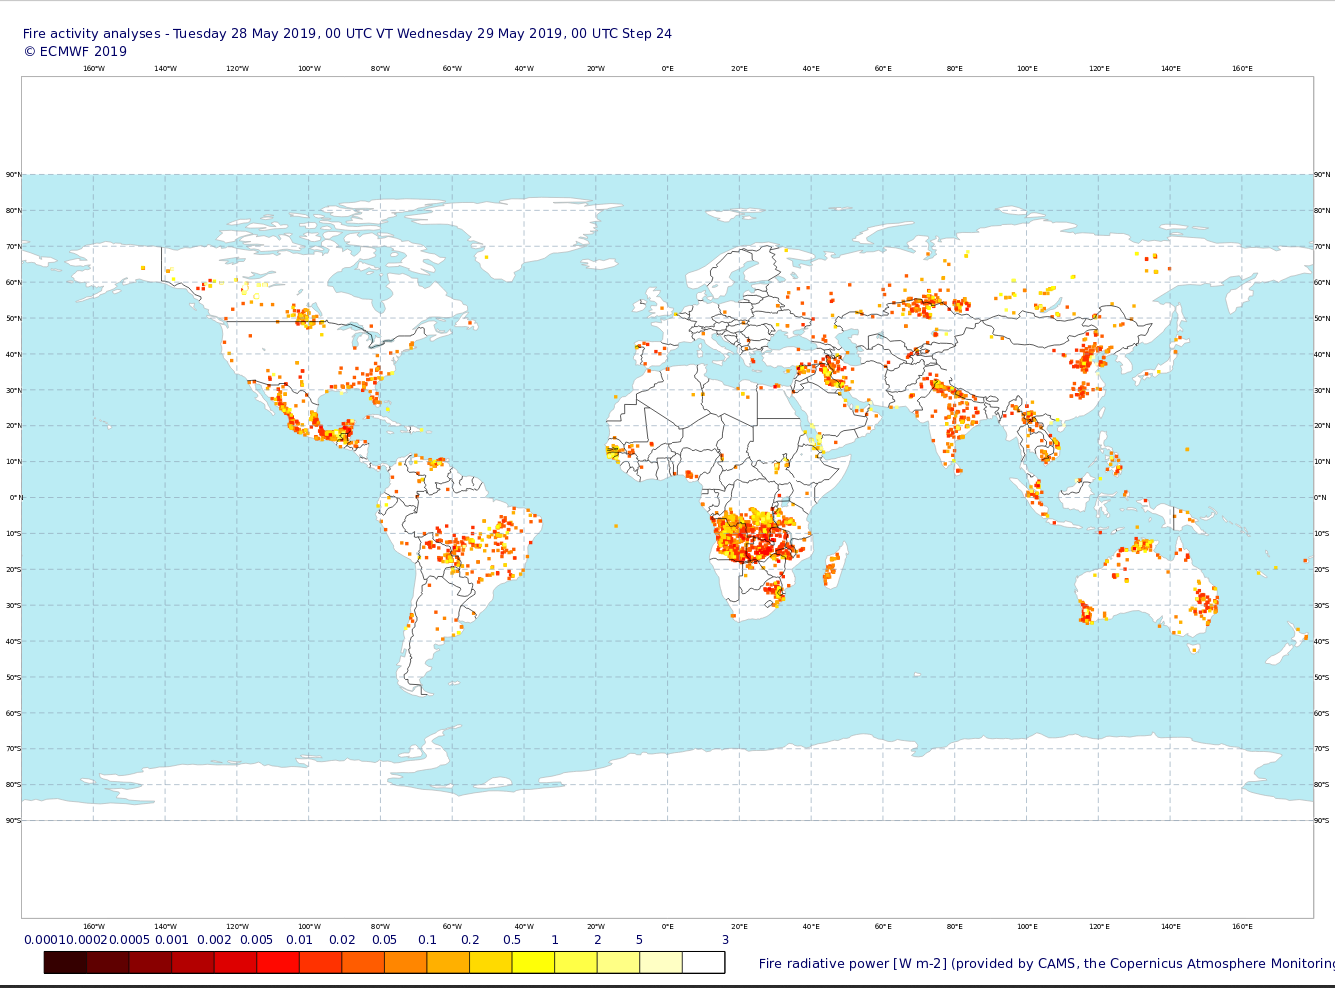
    • 20' The data (ESA, CAMS, EUMETSAT).
    • 30' Hands-on examples based on participants feedback gathered with Slido (Julia Wagemann, MEEO).


    The sessions will be hands-on and supported by Earth Observation and Model experts to discover data, handle them and produce plots out of a sample of the Copernicus data. You will make use of a series of freely available tools specifically developed for these applications, including Jupyter Notebook modules, to have an easy and intuitive way to make use of Python programming.
    No experience is necessary as various exercises will be provided for a wide range of skill levels and applications.
    It is recommended to join via laptop.

    Note: Slido will accompany the webinar session to collect your comments and answer your questions. The slido event will also stay open for the entire week (26-29 May) to support you during your individual data discovery.

    (3) Discover the data yourself and pick your dataset to play with

    A self-paced activity to start after the webinar until May 29th. You will receive support on slido with your questions.

    (4) 29 May, at 10:30 CEST. Sharing results, feedback and course evaluation (zoom link provided via email to registered participants)

    A final interactive sessions to discuss results, difficulties and provide us with your feedback.


    Few additional info:

    The European Union Copernicus programme is open and free for everyone - whether from academic, government, or commercial backgrounds. The programme has an operational focus, with satellite constellations and services. 

    Satellite data provides vital information on key atmospheric constituents, at different spatial and temporal scales, with continuous improvements in observational spatial and temporal resolution, coverage and measured species as well as a constantly evolving added value products from the Copernicus Atmospheric Monitoring Services.


  • Tout ouvrir

    Tout fermer

  • Instruction : un clic sur le titre de la section affiche ou masque cette section

  • 1
    The main objectives of EUMETSAT Atmospheric Composition SAF (AC SAF) is to process, archive, validate and disseminate atmospheric composition products from GOME-2 and IASI instruments onboard EUMETSAT Metop-A, -B, and -C satellites. These products include column-integrated concentrations of different trace gases such as nitrogen dioxide (NO2), ozone (O3) and sulphur dioxide (SO2), carbon monoxide (CO) UV-radiation, aerosol index as well as ozone profiles.  Important applications of AC SAF data include monitoring global air quality and UV-radiation reaching the Earth's surface. This section describes the observations from GOME-2 instrument relevant for this training and how to access the data. IASI  observations are described in a separate section. 
    • AC SAF provides three different types of datasets of GOME-2 observations: Near Real Time, Offline,  and Data Records. One of the main differences between these datasets is the time they are provided for users: NRT is available within 3 hours from observation, whereas Offline data becomes available typically within 1-3 days delay. 

      The primary dataset that will be used in this course is Level 2  Offline data of Absorbing Aerosol Index  (AAI). 

      Sources for browsing GOME-2 AAI images without downloading the data 

      1. The Temis service provided by KNMI provides near real time (last 24 hour composite) and an archive of global AAI images from GOME-2 instruments (A,B,C). Registration is not needed. 

      GOME2_AAI_TEMIS

      2. The SACS service provide also NRT and archived images of GOME-2 AAI. In this service you can also compare the AAI to other instrument observations, such as TROPOMI. There is also zoom in option, where you can select a specific grid on the globe. Registration is not needed. 

      SACS


  • 2

    This section provides you with an overview of Sentinel 5P - how you may access the data. In this course we will focus on Absorbing Aerosol Index (AAI) and CO TROPOMI S5P data. However, also other TROPOMI parameters, such as NO2 and HCHO can be accessed  and visualised using the instructions below. 


    • Sources for browsing S5P images without downloading the data

       
      Sentinel Hub EO Browser
       

      1. With  Sentinel Hub EO Browser you can quickly visualize different Sentinel data, including Sentinel 5P. Registration (which is free) is needed to be able to use all options in the EO browser. Registration can be done by selecting first "Login" from the Hub web page, and then "Sign Up" in the new pop-up window.
      EO Browser 1

      2. After login, by checking the box "Sentinel 5P" (you might uncheck the other boxes) a list of Sentinel 5P parameters appear that you can visualize. By selecting the time period from the calendar you can browse the images.

      EO Browser 2, CO example

      3. More info on EO Browser and its functionalities can be found here.

      Near Real Time and Archived Absorbing Aerosol Index from SACS

      The Support to Aviation Control Service (SACS) focuses on the timely delivery of SO2 and aerosol data derived from different satellite instruments to assess possible impact of volcanic eruptions on air traffic control and public safety. Even though the focus of the service is on volcanic eruptions, Absorbing Aerosol Index maps can give useful information on smoke emissions and transport from fires as well. In SACS AAI is available from several different instruments, including TROPOMI. 

      SACS

      From SACS service you can get the AAI maps from
      1. "Today", which shows the AAI observations from today only
      2. "NRT", which shows the AAI from the past 24 hours, i.e. it is a composite of  observations from today and yesterday.  
      3. "Archive", which shows observations for a specific day that you can select from the calendar. 

  • 3

    The Copernicus Atmosphere Monitoring Service (CAMS) provides consistent and quality-controlled information related to air pollution and health, solar energy, greenhouse gases and climate forcing, everywhere in the world. It is implemented by ECMWF on behalf the European Commissions and is one of six Copernicus data services. The principal CAMS datsets are global forecasts and analyses of reactive gases (O3, CO, NO2, SO2, HCHO), greenhouse gases (CO2, CH4) and aerosol optical depth. In addition to the atmospheric composition products, CAMS also provides near-real-time daily and hourly data on global fire emissions and inventories of anthropogenic and biogenic emissions. In this section you will find out how to access and download CAMS data. 


    • Examples of CAMS charts, for an aerosol forecast and fire activity analysis, are shown below and the latest charts can be viewed at https://atmosphere.copernicus.eu/charts/cams/.

      Example forecast chart of CAMS total aerosol optical depth

      Example chart of CAMS GFAS data

      CAMS analyses assimilate a wide range of satellite observations of meteorology and atmospheric composition (including from the Atmospheric Composition SAF and TROPOMI/Sentinel-5p), and initial conditions for the forecasts are taken from the analyses. Fire emissions are estimated currently based on active fire observations (fire radiative power) from the NASA MODIS instruments on the Terra and Aqua satellites. A full list of the satellite observations can be found at https://atmosphere.copernicus.eu/satellite-observations. In situ observations made at the ground and from aircraft and balloons are also vital to CAMS and are used to regularly evaluate and validate the datasets. Validation reports for the CAMS data can be found at https://atmosphere.copernicus.eu/node/325.

      More information on the CAMS Global Fire Assimilation System (GFAS) and fire emissions can be found at https://confluence.ecmwf.int/display/CKB/CAMS%3A+Global+Fire+Assimilation+System+%28GFAS%29+data+documentation.


  • 4

    You are invited to join the session XXXX at DATE TIME on LINK and share your impressions / thoughts on this course.

  • 5

    • COMET module CM SAF
    • COMET module LSA SAF
    • H SAF Jupyter notebooks???
    • ???