Topic outline


  • In this course, we will introduce you to the role of ground and air based in situ data and satellite ‘Earth observation’ (EO) technology in monitoring our atmosphere, and to the informative and critically important data it produces.

    This course will provide you with an overview of the different ways in which we monitor the atmosphere and will introduce you to the fundamental techniques and methodologies of working with this data. You will also learn about the ways in which this data is used to inform policy and decision making in attempts to negate and minimise the damage that is being done to our atmosphere.

    Significance of this Course

    The composition of our planet’s atmosphere is a delicate balance - even the slightest changes could be catastrophic. However this delicate balance is being put under pressure from multiple factors, such as air pollution and the emission of greenhouse gases, which is in turn having a very real and significant impact on our everyday lives. You will learn more about these factors and impacts throughout this course.

    What you will learn

    • Explore how we observe and measure the atmosphere with satellites, ground-based and other forms of in-situ measurements
    • Understand the importance of satellite observations and other forms of measurements for atmospheric monitoring
    • Investigate how atmospheric data is used in policy and decision-making, in a range of arenas, in conjunction with models
    • Recognise the importance of the data for monitoring long-range transportation of pollutants in the atmosphere

    Downloads

  • Week 1: Our Fragile Atmosphere and the Challenges We Face


    Week 1 of the course will introduce you to the Earth's atmosphere and why we monitor it.

    Topics covered include threats the atmosphere is facing and why monitoring matters;  an introduction to the Copernicus Programme and CAMS; the structure of the atmosphere; what we measure; the different satellites used to measure the atmosphere; and how atmospheric data can support enterprises and innovative solutions.


    • 1a: The threats to our fragile resource

      • Why monitoring matters

        The atmosphere is vital for life on Earth, it shields us from harmful ultraviolet radiation and helps regulate the temperature of the planet, keeping the Earth warmer than it would be without it. It also provides the 13 kg of air we breathe in each day and supplies carbon dioxide to plants for the process of photosynthesis. However, it can also affect us in negative ways, particularly in the case of atmospheric pollution.

        It is estimated that pollutants in the atmosphere cause the death of 4 - 7 million people worldwide each year, most of these being in China and India, where the density of human population and industry are extremely high. In Europe this figure is around 400,000 each year. Small particles released into the atmosphere from power plants, factories, vehicle exhausts and from the burning of coal and wood are the main contributors to atmospheric pollution and can impact human health in a variety of ways. The number of fine particles (PM 2.5) in the air on a bad day in a city such as Beijing can be as much as 300 micrograms per cubic metre. The EU’s annual mean limit for PM2.5 is 25 micrograms of particles per cubic meter of air.

        Clorofluorocarbon (CFC) pollution in the atmosphere caused the creation of a hole in the ozone layer, which was found from satellite data in 1985, and resulted in global cooperation to ban CFCs.

        Observing the atmosphere can provide us with important knowledge on, changes to atmospheric composition and the tracking of pollutants, which in turn allows us to inform governments and businesses on the impacts of atmospheric pollution on public health, the environment and the economy.

        Featured Educators:

        • Prof. John Remedios
        • Dr Matthieu Plu
        • Prof. Paul Monks
        • Prof. John Burrows
        • Dr Martin Adams


        Downloads


        See also

    • 1b: Copernicus, CAMS and Global Networks

      • The importance of collaboration

        Previously known as the Global Monitoring for Environment and Security programme (GMES), the Copernicus Programme is one of the biggest Earth observation programmes in the world.

        Copernicus is an EU programme for satellite Earth Observation, previously known as the Global Monitoring for Environment and Security programme (GMES), it is headed by the European Commission (EC) in partnership with the European Space Agency (ESA).

        Copernicus provides a unified system through which vast amounts of data are fed into a range of thematic information services designed to benefit the environment, the way we live, humanitarian needs and support effective policy making for a more sustainable future.

        The data they provide is freely available to everybody, so we can make choices about what we do and how we as a society look after and use the marine environment. It serves users from businesses and public services to researchers and curious individuals.

        The Copernicus Atmosphere Monitoring Service (CAMS) is part of the Copernicus Programme. It provides the capabilities to continuously monitor the Earth Atmosphere at both global and regional scales. The main areas of focus are:

        • Air quality and atmospheric composition
        • Ozone layer and ultraviolet radiation
        • Emissions and surface fluxes
        • Solar radiation
        • Climate forcing

        No single organization can do it all – different organisations have different skills and mandates. Regional organization support national efforts. EUMETSAT provides the satellite data for CAMS including from operations of Sentinel-3, 4 and 5. And the European Environmental Agency provide in situ data.

        Featured Educators

        • Dr Vincent-Henri Peuch
        • Dr Mauro Facchini
        • Dr Martin Adams
        • Prof. John Remedios

        View featured satellites on the satellite tracking app

        Downloads

        See also

        • CAMS information PDF PDF containing information on the Copernicus Atmosphere Monitoring Service
        • CAMS Website The Copernicus Atmosphere Monitoring Service official website
      • The role of satellites in CAMS

        Satellite data is an important part of Copernicus and CAMS as it provides a complete global picture of the atmosphere which would otherwise be unattainable if measurements were solely taken from in-situ instruments.

        The network of Earth observation satellites that provide data for Copernicus are split into two groups of missions: the Sentinel satellites which were developed specifically to meet the needs of Copernicus, and the Contributing Missions , which supply complimentary data to make sure that all observational requirements are met. The current and planned Contributing Missions are comprised of missions from ESA, European and international organisations and both ESA and EUMETSAT are responsible for the operation of the current Sentinel satellites.

        Both of these groups of missions work to continuously monitor and relay essential data back to Earth through the Copernicus Ground Segment - which processes, stores and disseminates the data so that it is ready for operational use .

        Featured educators

        • Dr Mark Parrington
        • Dr Mauro Facchini

        View featured satellites on the satellite tracking app

        Downloads

    • 1c: Supporting enterprise and innovative solutions

      • Data processing and supercomputers

        Open access to data is one of the key principles of Copernicus. The vast amount of information gathered by satellite and ground-based systems is provided freely and openly to all Copernicus users so that the data can be made use of in a wide range of applications that benefit citizens. In order to make the collected observations readily available to end users, the data must first be processed by supercomputers and stored in an easily accessibly way.

        The large quantity of data made available through Copernicus is highly beneficial to a variety of services, the public and also the private sector. Many businesses and technological innovations are increasingly responding to environmental issues and the urgent need for sustainability leading to enterprises capitalising on available atmospheric data products for research, development and innovation,

        An example of such a business is SolarAnywhere. SolarAnywhere provides a solar prediction tool which utilises a combination of satellite imagery and solar installation data to model energy production and help find the best locations for solar energy generation. It is used by the world’s leading solar energy developers and independent engineering firms.

        Featured Educators

        • Dr Vincent Henri Peuch
        • Dr Mark Parrington
        • Antonio Mariano

        Optional Mini Task

        Visit this World Energy Council page to use the Energy Trilemma Index tool

        The World Energy Council’s Energy Trilemma Index tool, produced in partnership with Oliver Wyman, ranks countries on their ability to provide sustainable energy through 3 dimensions: Energy security, Energy equity (accessibility and affordability), Environmental sustainability. The ranking measures overall performance in achieving a sustainable mix of policies and the balance score highlights how well a country manages the trade-offs of the Trilemma with “A” being the best. Use this interactive Index to assess the sustainability of national energy policies.

        Downloads

      • Monitoring clean energy innovations

        Helen Ltd based in Finland, produce the most efficient energy in the world. They aim to achieve 100% carbon neutrality in their energy production through their power plants in Helsinki, and currently have around 400,000 customers throughout Finland.

        Featured educators
        • Pirjo Jantunen
        • Dr Iolanda Ialongo

        Downloads

        See also

      • Other examples

        In this video Paul Monks and Martin Adams will talk about some more examples of how atmospheric data supports enterprises and innovative solutions, and Iolanda Ialongo talks about how satellite measurements help with rules and regulation.

        Featured Educators

        • Prof. Paul Monks
        • Dr Martin Adams
        • Dr Iolanda Ialongo

        Downloads

    • 1d: Unravelling the complex structure of the Atmosphere

      • What is the atmosphere made up of?

        The majority of Earth’s atmosphere is comprised of Nitrogen (78%) and Oxygen (21%), followed by Argon (0.9%). The atmosphere extending upwards 600 km, is divided into four regions of positive and negative temperature gradient. These regions are the Troposphere, the Stratosphere, Mesosphere, and Thermosphere. The ozone layer is located in the Stratosphere, which extends to 50 km high. The Thermosphere extends to 600 km and this is where many satellites can be found. After these four regions is the Exosphere, here the atmosphere is incredibly thin, and the layer gradually gives way to deep space. Satellites can also be in this layer.

        The Stratosphere has a positive temperature gradient and oxygen (O2) concentrations increase rapidly towards lower altitudes. In this layer chemical reactions involving solar ultraviolet radiation (sunlight) and oxygen molecules take place, forming ozone (O3). In the troposphere there is a negative temperature gradient. Here the constituents (gas and aerosols) are constantly being mixed and changing. The natural sources of atmospheric constituents include direct release from the biosphere, exchange at the surface, lightning, natural fires, and stratospheric-tropospheric exchange. However anthropogenic activity, such as biomass burning and fossil fuels is modifying tropospheric chemistry.

        Featured Educators

        • Prof. Paul Monks
        • Prof. John Remedios
        • Dr Vincent-Henri Peuch

        Downloads

        See also

    • 1e: Climate change and the Anthropocene

      • Over a 10,000 year period, from the Neolithic revolution to the industrial revolution, the population rose from a few million to over 1 billion people, spurred by the use of energy from a mixture of biofuels, water and solar power, and a small amount of coal. Since the industrial revolution, which began in the UK in the 18th Century, until now, the population has reached far over 7 billion people, powered by the combustion of fossil fuels, coal, oil and gas. By 2050 the population is expected to reach 10 billion people.

        This era, known as the Anthropocene has resulted in local and global scale pollution; the destruction of stratospheric ozone; land use change - by 2005, humans had converted nearly two-fifths of Earth’s land area for agriculture, and one-tenth to urban areas; the modification of biogeochemical cycling; the destruction of species ecosystems and ecosystem services; and climate change.

        Over the last 150 years human activity has been the cause of increasing greenhouse gases (GHG)in the atmosphere. The largest release being Carbon Dioxide (CO2) from burning fossil fuels and industrial processes, followed by Methane (CH4). The increase in GHG has caused global temperatures to rise, which can be seen in the famous ‘hockey stick’ graph, where average global temperatures went from a steady slight decline into a sharp, steady increase in 1900.

        Satellite observations combined with modelling helps to improve our knowledge on CO2 and CH4 sources and sinks which is required for better climate prediction.

        Featured Educators

        • Prof. John Burrows

        See also

    • 1f: What we measure – overview of key parameters measured with satellite

      • Through the use of satellites and in situ data, many different elements of the atmosphere can be measured. It is important to use both satellite and in situ data so we can get as many measurements as possible. Measurement stations on the ground can provide information about local air quality, and satellites provide measurements over wide areas.

        Things that we can measure include:

        • The Ozone layer
        • GHGs:
          • Carbon Dioxide (CO2)
          • Methane (CH4 )
          • Nitrous Oxide (N2O)
        • Reactive gases:
          • Formaldehyde (CH2O)
          • Sulphur Dioxide (SO2)
          • Carbon Monoxide (CO)
        • Fire radiative power
        • Aerosol optical depth

        There are also things that we cannot measure from Space, such as indoor pollution which can be from domestic fuel burning, and also things such as pollen and mold, and formaldehyde from furniture. Around 3 billion people cook and heat their homes using solid fuels on open fires or traditional stoves, and 4.3 million people a year die from the exposure to household air pollution.

        Featured Educators

        • Prof. John Burrows

        • Dr Rosemary Munro


        Optional mini task

        For this optional mini task download the NASA Visualization Explorer app from the Google Play Store or Apple App Store here. Once downloaded, click on the menu button located on the top left and select Earth from under the Stories by Topic section.

        Have a look through the various stories and see what you can find in relation to atmosphere. One example would be “Carbon Dioxide in 3-D”, however there are many more options. 


        Optional further reading

        Downloads

    • 1g: Satellite measurements

      • Measuring the absorption of light in the atmosphere


        There is a variety of satellites that are capable of measuring atmospheric composition, that utilise many different instruments.
        Some of the key missions and instrumentation include:

        Metop - A series of three polar orbiting meteorological satellites. They include the IASI (infrared atmospheric sounding interferometer) instrument which estimates and monitors the trace gases ozone, methane, carbon monoxide, N2O and CO2 (total column only) on a global scale. And the GOME-2 (Global Ozone Monitoring Experiment–2) instrument, which provides ozone profiles and measures atmospheric content of ozone.

        Sentinel-3 - Part of the Sentinel series of satellites in the Copernicus programme, Sentinel-3 is primarily an ocean mission but also provides atmospheric data. It’s OLCI (Ocean and Land Colour Instrument) instrument can provide atmospheric composition (mainly aerosols and water vapor), illumination condition, and downwelling solar radiation data.

        Sentinel 5 Precursor - Sentinel-5p is the first satellite in the Copernicus programme that is dedicated to monitoring air pollution. Its instrument is the Tropomi (TROPOspheric Monitoring Instrument) and is the most advance multispectral imaging spectrometer to date and can measure in the ultraviolet and visible (270–500 nm), near-infrared (675–775 nm) and shortwave infrared (2305–2385 nm) spectral bands. It can take measurements of ozone, nitrogen dioxide, formaldehyde, sulphur dioxide, methane, clouds, surface UV-B and carbon monoxide.

        Aura - Aura is part of NASA’s Earth Observing System and measures Earth’s ozone layer, air quality and climate. It carries four instruments, these being a HRDLS (High Resolution Dynamics Limb Sounder) which measures infrared radiation from ozone, water vapor, CFCs, methane and nitrogen compounds; MLS (Microwave Limb Sounder) which measures emissions from ozone, chlorine and other trace gases, and clarifies the role of water vapor in global warming; OMI (Ozone Monitoring Instrument), which uses ultraviolet and visible radiation to produce daily high-resolution maps; and TES (Tropospheric Emission Spectrometer) which measures tropospheric ozone in infrared wavelengths, also carbon monoxide, methane and nitrogen oxides.

        Future capabilities

        Sentinel-4 - is an instrument, the Ultra-Violet and Near Infra-Red Multispectral Spectrometer (S4 UVN), which will operate with spectral bands within the solar reflectance spectrum. It will work closely with the Infra-Red Sounder (IRS) on the Meteosat Third Generation sounding satellites to observe ozone carbon monoxide, sulphur dioxide and other trace gases. The Sentinel-4 instrument will monitor key air quality trace gases and aerosols over Europe in support of air quality monitoring and the Copernicus Atmosphere Monitoring Service (CAMS). The EUMETSAT Meteosat Third Generation Sounder (MTG-S) satellites are due to be launched in 2023 and 2030.

        Find out more here.

        Sentinel-5 - the Sentinel-5 instrument will also be dedicated to atmospheric monitoring, and will consist of a payload carried aboard EUMETSAT’s Metop Second Generation satellites launching from 2022. It will provide operational monitoring of trace gas concentrations for atmospheric chemistry and climate applications.

        Find out more here.

        Featured Educators:

        • Prof. John Remedios

        • Prof. John Burrows

        • Dr Rosemary Munro

        Downloads


      • Example instruments and missions

        In this video John Burrows and Paul Monks go into more detail about atmospheric missions and instruments.

        Featured Educators

        • Prof. John Remedios

        • Prof. John Burrows

        • Prof. Paul Monks


        Downloads

    • Course EO satellite missions table

      Now that you have covered the initial topics in Week 1, we hope that you are starting to become familiar with key terms, technologies and names of satellite missions. You can download and use the table, from the downloads section on the right, to explore all of the Earth observation satellite missions that are mentioned throughout this course. You can refer back to this table at any time, and additional links to these missions can be found in each topic.

      Downloads


    • Interactive exercise

      For this exercise we will be looking at Breezometer which provides accurate live air quality emissions around the world. It provides real-time information on health sensitivities related to air pollution, indoor and outdoor pollutant levels, and if it is safe for children and sport activities.

      1. Click here to go to the Breezometer website.
      2. Search for an area of your choice using the search bar. This could be where you live, where you work or study, or just an area you are interested in.
      3. What is the dominant pollutant in the area? What are the levels for each pollutant? How do levels change depending on the time of day? 
      4. Compare this area to somewhere else of your choice. Is it similar or different, can you tell why this might be? 


  • Week 2: Pollution, Air Quality and Health


    Week 2 of the course will look at types of atmospheric pollution, methods of measurement and how pollution effects human health in more depth.

    We will look into more detail at air quality and the types of atmospheric pollution, how we measure and model this pollution and the effects this pollutants have on human health. This week will also go over the various techniques for how this data is collected from multiple sources, combined and then mapped out into models and digestible data sources, which can then be used to create policy and help people who are at risk to avoid areas where pollution is high.


    • 2a - Air quality and types of atmospheric pollution

      • Air quality refers to the chemical composition of trace constituents close to the surface of the earth, which impact on humans. It is a global issue. Emissions from human activities, sunlight, weather, pollution from far away, wildfires, and wind-blown dust can all affect air quality.

        Before satellites, air quality could only be monitored in situ. For example in 1961, 5 years after the UK government introduced the Clean Air Act following on from the 1952 great smog of London, the UK established the world’s first co-ordinated national air pollution monitoring network, called the National Survey. This was comprised of around 1200 monitoring sites around the UK measuring black smoke and sulphur dioxide. The National Survey have now been monitoring air pollution for over 60 years.

        In situ measure are important for measuring pollution, however satellites need to be used to get a larger picture. Currents of air blow gaseous and particulate pollutants across regions, countries and even to different continents.

        Featured Educators:

        • Prof John Burrows

        • Dr Mauro Facchini

        • Dr Matthieu Plu

        • Dr Ruediger Lang

        Optional Further Reading

        Downloads


    • 2b: Air quality measurements - in situ instruments & validating satellite data

      • In situ measurements are ones that are obtained through direct contact with the respective subject.

        In this video Dr Andreas Richter shows us an in situ instrument on the roof of Bremen University in Germany. This is the IUP-Bremen MAX-DOAS (Multi Axis Differential Optical Absorption Spectroscopy) instrument. This instrument is equipped with a smaller telescope housing which is mounted on a pan-and-tilt head that allows a direct pointing in any viewing direction.

        The instrument works by light, that has been scattered in the atmosphere, entering the telescope housing through a quartz glass window, and this light is focused by a lens limiting the field of view onto an optical quartz fibre bundle, which is then looked at in the lab.

        In situ instruments like this one can be used for the validation of satellite measurements. The MAX-DOAS instrument for example can be compared with measurements from satellite instruments such as GOME, GOME-2, SCIAMACHY, Sentinel-5p and OMI.

        Featured Educator:

        • Dr Andreas Richter


        Optional Further Reading


        Downloads

      • Mobile in situ measurements


        Monitoring methods can range from on the ground to planes, towers, spacecraft, or wagons. Different kinds of measurements can be combined together to get a full picture and the most accurate data.

        The University of Bremen has a mobile measuring unit called the ‘Messwagon’. It is essentially a van equipped with a number of atmospheric measuring instruments. Instruments include an intake tube which sucks in air and this air is sent to different instruments to be analysed, and a MAX-DOAS telescope, both of which can be found on the roof.

        In this video Dr Folkard Wittrock will look at the Messwagon and it’s instruments in detail, and show examples of the data it produces.

        Featured Educators:

        • Dr Folkard Wittrock

        Downloads

    • 2c: Street level sensing

      • The role of ultra-local monitoring


        Many urban areas around the world have local street level air quality monitoring. The City of London Corporation has been monitoring air quality in the Square Mile since the 1960s, after the Clean Air Act was introduced, monitoring sulphur dioxide and black smoke. Since 2001 the City has been an Air Quality Management Area for nitrogen dioxide (NO2) and fine particles (PM10), so monitoring now focuses on these pollutants.

        Ground sensors in the City of London include 60 ‘diffusion tubes’ which monitor nitrogen dioxide, and continuous analysers, at 5 locations, which monitor one or more of NO2, PM10 and PM2.5 24 hours a day. The London Air Quality Network (LAQN), run by King’s College London, monitors air pollution in the whole of Greater London, and was formed in 1993. This covers over 100 continuous monitoring sites in the majority of London’s 33 boroughs.

        Data from LAQN this year has shown that Brixton Road has become the first place in London to breach objectives for nitrogen dioxide (NO2) for 2018. However NO2 has considerable decreased in concentrations along Putney High Street, Brixton Road and Oxford Street over the last two years. This is likely due to a combination of better real-world emissions performance of the latest heavy goods vehicles and upgrades to London’s bus fleet. There have been a number of air quality legislation in London that has been recently implemented or will be in the near future. These are:

        • London Toxicity Charge (T-Charge)

        • Ultra Low Emission Zone (ULEZ)

        • Clean Vehicle Checker

        • London Taxis

        • London Buses


        Featured Educator:

        • Dr David Green

        Optional further reading


        Downloads


        • Instruments & particle measurement


          In this video Dr David Green talks about PM10 and PM2.5, and goes into more detail about the street level sensors in London, showing us what they do and how they work to monitor pollutants.

          Featured Educator:

          • Dr David Green

          Downloads

      • 2d: Air quality, NO2, CO & the ozone layer

        • Satellites can measure lots of different sources of atmospheric pollution, such as Nitrogen Dioxide, Ozone, Carbon Monoxide and Particulate Matter. And from these measurements, data products can be produced. Data products are the end product that is made available to users after the analysis of the satellite measurement data or forecast system modelling, for example, is complete.

          Data products are extremely important for a range of different users, particularly in order to manage air quality as it has enormously negative effects on human and environmental health.

          In this video Dr Mark Parrington talks about data products at CAMS, how satellite data is validated, and looks at three examples of a data product.

          Featured Educators:

          • Dr Mark Parrington


          Optional further reading


          Downloads


        • Applications case study: NO2 models


          In this video Johannes Flemming looks at a model showing Nitrogen Oxides produced from Lightning.

          Lightning is the most important source of Nitrogen Oxides (NOx) in the upper troposphere, as it indirectly influences the climate because it partly controls the concentration of ozone and hydroxyl radicals (OH) in the atmosphere. The high temperatures produced from a lightning strike causes Nitrogen and Oxygen (O2) in the air to react, forming Nitric Oxide (NO). The NO then very quickly reacts with more O2 to form Nitrogen Dioxide (NO2).

          Featured Educator:

          • Dr Johannes Flemming


          Downloads

      • 2e: International agreements for air quality


        • In order to manage the Earth’s resources and control atmospheric pollution from the local to the global scale, international agreements occur.

          European Monitoring and Evaluation Programme (EMEP) is a co-operative programme for monitoring and evaluation of the long range transmission of air pollutants in Europe. It is a scientifically based and policy driven programme under the Convention on Long-range Transboundary Air Pollution (CLRTAP) for international co-operation to solve transboundary air pollution problems. CLRTAP was signed in 1979 and entered into force in 1983 and has 51 parties. The EMEP’s aim is to regularly provide governments and subsidiary bodies under the CLRTAP Convention with qualified scientific information to support the development and further evaluation of the international protocols on emission reductions negotiated within the Convention.
          It address the formation of ground level ozone, persistent organic pollutants (POPs), heavy metals and particulate matter, as well as eutrophication and acidification.

          Local air quality acts include the UK Clean Air Act, which was the first one in the world, followed by the US version, which is currently under review.

          Featured Educators:

          • Prof John Burrows

          • Dr Martin Adams

          • Dr Mark Parrington

          Optional Further Reading


          Downloads

      • 2f: Practical Products – City level apps for air quality and health


        • Bad air quality is a major environmental risk to human health. Health problems caused by pollution include cardiovascular and respiratory illness, added stress to heart and lungs, damaged cells in the respiratory system, development of diseases such as asthma, bronchitis, emphysema, and possibly cancer. The WHO estimated that in 2012, some 72% of outdoor air pollution-related premature deaths were due to ischaemic heart disease and strokes, while 14% of deaths were due to chronic obstructive pulmonary disease or acute lower respiratory infections, and 14% of deaths were due to lung cancer.

          In the UK air pollution kills around 40,000 people each year, and 4.6 million worldwide. To help people avoid the dangers of air pollution there are many near real-time forecasting applications. An example of this is Riga airText, which is an app that provides air pollution forecasts for the city of Riga in Latvia.

          Featured Educators:

          • Dr Mark Parrington

          • Dr Richard Engelen

          Optional Further Reading


          Downloads
      • Atmosphere Extras – Citizen science


        • Citizen science involves members of the general public collaborating with scientists on a project. It is a great way for people to learn about air pollution where they live and also for local scientific research, as it provides data from more sources then ground-based stations and gives a more regional perspective than satellite data.

          iSpex-EU was a citizen science project that allowed the public to use their smartphones to measure air pollution. It ran from 1 September to 15 October 2015 and 5386 measurements were made.

          Britain Breathing - A citizen science project that aims to engage the UK public to act as ‘citizen sensors’ to help scientists discover more about seasonal allergies such as hay fever or asthma, which may be caused by different pollen, pollution or the weather. It involves using a phone app to log allergy symptoms.

          Friends of the Earth Clean Air Kit campaign is another UK based citizen science project. It involves the public installing a tube to measure NO2 in a location of their choice. They then mail this back after 2 weeks. The results will help to build a picture of air pollution across the UK, as well as to enable people to discover what air pollution is like in places that matter to them.

          SenseBox - Is a German based citizen science toolkit which works as a low-cost weather station. It can be used to measure light intensity and ultraviolet light, temperature, air moisture, and air-pressure, and future extensions will provide air quality measurements. There are two versions of the kit, senseBox: home for use local research and senseBox:Edu for schools and junior scientists.

          The European Space Agency set up a project called EducEO, to review existing citizen science projects to to enhance the scientific exploitation of Earth Observation (EO) data while simultaneously supporting education and public awareness raising of EO.

          Breath Clean - Tower Hamlets, London is a ongoing local citizen science project that commenced in May 2018. It provides Tower Hamlets residents with the materials & training needed to monitor nitrogen dioxide levels around the places that matter to them.

          Air quality Citizen Science This is a NASA funded project which aims to collect spatially dense, quality PM2.5 data using low-cost sensors deployed by citizen scientists. The data will be compared to NASA satellites. They are currently recruiting citizen scientists based in Southern California, and will be expanding to other regions later on. You can sign up to take part here

          Citizen-Enabled Aerosol Measurements for Satellites (CEAMS) This is another NASA funded Citizen Science project which is led by Colorado State University, and measures local air quality using using inexpensive, but high-quality instruments to take backyard measurements. You can take part if you are based in the USA.

          Featured Educator:

          • Dr Martin Adams

          Downloads


          iSpex results

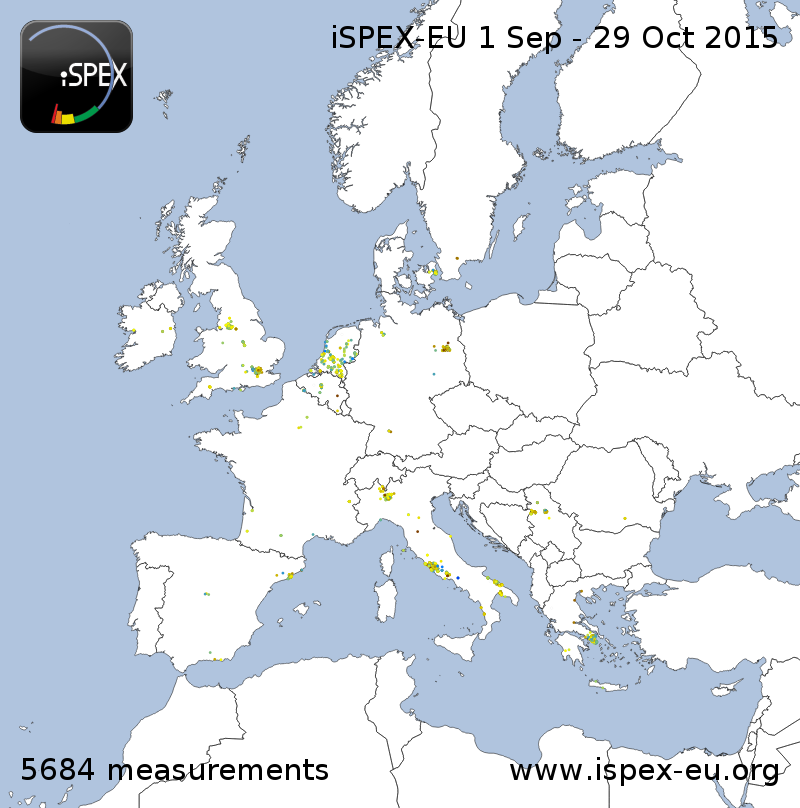
          The preliminary results of the iSpex project showing all results collected between 1st September - 29th October 2015.Copyright: iSpex-EU http://ispex-eu.org


      • Interactive exercise

        The ability to monitor and track air pollution is vital in being able to understand how much is coming from where, how we can reduce it and mitigate its negative effects. Pollution.org provides an interactive world map with data on air, water and soil pollution globally. Sources are credible, government approved data-sets and updated on a regular basis.

        Task

        Visit Pollution.org on your browser.

        1. Focus on air pollution by toggling contaminated sites and water pollution off.

        2. Select two locations of interest on the map and take a look at the AQI (air quality index)

        3. Is there a significant difference in AQI levels or not? Why might this be?

        4. Share your findings in the discussion section below


    • Week 3: Large Scale Changes – Ozone and GHGs


      Week 3 will look at how we monitor GHGs from both satellites and in-situ measurement methods.

      We will look at how we can accurately measure GHGs to help aid us in dealing with climate change and particularly methane, which is one of the most potent GHGs in the atmosphere. This week will also look at measurement techniques such as using aircraft to measure CO2 and methane, the data products we can use to GHGs and ozone hole prediction, and how policy has been implemented to combat this.


      • 3a: GHGs and climate change – how the data helps us understand the past and the future


        • Our ability to measure and model greenhouse gases (GHGs) is pivotal in the monitoring and management of climate change. Collecting measurements of GHG emissions allows us to identify the increase in atmospheric constituents over time and to observe the daily and seasonal cycle of their concentration in the atmosphere. When we feed these observations into powerful models of the Earth system we can map their movement through the atmosphere and identify the source regions that GHG emissions originate from. This ability to trace emissions back to their origin is extremely helpful when creating policies that focus on mitigating climate change. We can also identify the processes that remove GHGs from the atmosphere - so called GHG ‘sinks’. This allows us to understand more about the lifetime of GHGs in the atmosphere and also their role in the carbon cycle.

          One such satellite is Sentinel-5P.This satellite was launched in October 2017 and carries the Tropospheric Monitoring Instrument (Tropomi). This instrument measures atmospheric trace gases such as nitrogen dioxide, ozone, carbon monoxide and methane and aims to provide daily worldwide measurements for the next seven years. Copernicus’s future launches of Sentinel-5 and Sentinel-7 will further add to the data available on GHGs.

          Featured Educators:

          • Dr Anna Agusti-Panareda

          Optional Further Reading


          Downloads

        • Stratospheric ozone and CFCs – Detailed insights from satellite data and models


          Chlorofluorocarbons (CFCs) are organic molecules that contain carbon, chlorine, and fluorine atoms. After their invention in 1928, CFCs were widely used in manufacturing processes due to their non-toxic, non-flammable nature and were released into the atmosphere from various sources such as air-conditioning, refrigeration, blowing agents in foams, insulations and packing materials, propellants in aerosol cans, and solvents.

          Studies undertaken by various scientists during the 1970s revealed that CFCs released into the atmosphere accumulate in the stratosphere, where they had a damaging effect on the ozone layer. In 1976, the U.S. National Academy of Sciences (NAS) released a report that confirmed the scientific credibility of the ozone depletion hypothesis. NAS continued to publish assessments of related science for the next decade.

          In 1985, British Antarctic Survey scientists presented the first satellite image of the ozone hole over Antarctica. A few years later atmospheric chemist Susan Soloman proposed that the hole was created by chemical reactions on polar stratospheric clouds (PSCs) which cause a localised and seasonal increase in the amount of chlorine present in active, ozone-destroying forms. There are now many satellite instruments which monitor ozone, including the Ozone Monitoring Instrument (OMI) on the Aura satellite and the Global Ozone Monitoring Experiment-2 (GOME-2) instrument on the Metop series of satellites.

          In this video Dr Johannes Flemming explores detailed images of the vertical structure of ozone concentrations over Antarctica.

          Featured Educators:

          • Prof. John Burrows

          • Dr Annette Ladstaetter Weissenmayer

          • Dr Johannes Flemming


          Optional mini task

          NASA has a website called NASA Ozone Watch which is dedicated to providing images, data and information on atmospheric ozone. This is free to access and available for everyone to use.

          Visit NASA Ozone Watch and have a look at the ozone movies. A full table of all ozone movies is available in the multimedia section. Select two videos from different years, do you notice any differences in the ozone hole? Discuss your findings below whilst stating the dates you looked at.

          Optional Further Reading


          Downloads

      • 3b - Methane models and measurements

        • Methane is one of the most potent greenhouse gases in Earth’s atmosphere and measurements of its atmospheric concentration are vital to the monitoring of climate change.

          Methane is emitted from a range of natural and anthropogenic sources. Natural sources are due to anaerobic decomposition of matter, and come from sources such as wetlands, animals, plants, and permafrost. Anthropogenic sources include agricultural livestock, land use change, rice cultivation, waste practices, coal mining, natural gas distribution, and biomass burning.

          From the 1800s, to the early 1990s atmospheric methane concentrations increased annually at a rate of about 0.9%. However they “flatlined” from around 1999 to 2006, but since then have been hitting new highs. The National Oceanic and Atmospheric Administration (NOAA) has been measuring atmospheric methane concentrations in air samples from locations around the world since the early 1980s, giving scientists a picture of growth rates at different latitudes over the past 35 years. A hypothesised reason for a decline in the late 1990s to min- 2000s in the Northern Hemisphere has been attributed to industrialized countries, including the United States, gaining better control of “fugitive” methane emissions, which escape during the drilling and pumping of oil and natural gas. The rapid increase in emissions since 2006 is currently a topic of debate amongst scientists, however increased emissions from tropical wetlands are considered to be a likely source.

          The SCIAMACHY sensor that was aboard the Envisat satellite performed the first space-based measurements of the global distribution of near-surface methane in 2003. Since then other satellites, such as Metop, GOSAT, and Sentinel-5p are able to take measurements of methane from space.

          Featured Educators:

          • Dr Anna Agusti-Panareda

          Optional mini task

          Visit methanelevels.org. On this page you will see an interactive graph displaying global methane measurements for the past 1000 years or so. By hovering over each section with your mouse you can find out how methane levels from that time period compare to present day levels. You can also zoom into each section by highlighting it with your mouse. There is also the added option of extending the time period to the last 800,000 years or inserting an overlay of the historical temperature record using the two icons located on the top left of the screen.

          What do you notice about the growth of methane levels over time, and during specific time periods?


          Optional Further Reading


          Downloads


      • 3c: High altitude balloon measurements - Overview


        • Balloons are a unique tool for scientific research as they can stay aloft long enough in the stratosphere which is a region of the atmosphere too low for orbiting satellites, unlike sounding rockets which are too fast to obtain meaningful data. The balloons can operate at as low as a few hundred metres or up to 40km high, and are used for a wide range of experiments. The balloons are also able to stay afloat for several months to achieve the required results.

          Stratospheric balloons have been used to validate satellite data. For examples CNES launched a balloon in 2005 to validate the atmospheric ozone measurements Enivisat had acquired from space. A a zero-pressure stratospheric balloon was used which stayed aloft at its ceiling altitude for about 2-and-a-half hours, and took measurements using an adapted version of the MIPAS atmospheric sounding instrument which is on board Envisat.

          Featured Educators

          • Dr Philippe Cocquerez

          Optional Further Reading


          Downloads

        • High altitude balloon measurements - In more depth


          Featured Educators

          • Dr Frederic Thoumieux


          Downloads


      • 3d: Measurements from aircraft - overview of IAGOS

        • Commercial passenger aircraft have also been successfully utilised for taking atmospheric measurements. Using commercial aircraft has made it possible to carry out observations of atmospheric composition on a scale that would be impossible to achieve using research aircraft.

          IAGOS (In-service Aircraft for a Global Observing System) project has a fleet of 9 aircraft made up of Lufthansa, China airlines, Hawaiian Airlines, Cathay Pacific, and Air France planes. These aircraft were fitted with instrumentation which take regular in situ measurements of atmospheric chemical species (O3, CO, CO2, CH4, NOx, NOy, H2O) 1 , aerosols and cloud particles.

          IAGOS data are being used by researchers worldwide for process studies, trend analysis, validation of climate and air quality models, and the validation of space borne data retrievals.

          Featured Educators

          • Dr Valerie Thouret

          • Dr Philippe Nedelec


          Optional mini task

          View the Global Map of Methane Sites and have a look at the sources of methane around the world. What is the most common source in your country?

          Downloads

        • Measurements from aircraft - data examples from IAGOS

          Further detail about data acquired by the IAGOS programme, with Hannah Clark.

          Featured Educator

          • Dr Hannah Clark

          Downloads


      • 3e: The Vienna Convention and Montreal Protocol – an exemplar for international policy

        • The Vienna Convention for the Protection of the Ozone Layer is a Multilateral Environmental Agreement that was agreed upon at the Vienna Conference of 1985 and entered into force in 1988. It acts as a framework for the international efforts to protect the ozone layer. The Montreal Protocol lays out the legally binding reduction goals for the use of CFCs. It took place due to scientific research on the negative effect of CFCs on ozone in the 1970s and the discovery of the ozone hole in 1985.

          The Montreal Protocol has been instrumental in phasing out the production and use of CFCs resulting in a slowed-down depletion of the ozone layer. Climate scientists studying three decades of ozone measurements from seven satellites see a positive trend in global recovery thanks to international efforts to curb ozone-depleting substances. It provides a stable framework that allows governments, industry, environmental groups and scientists and technical experts to work together to plan long-term research and innovation.


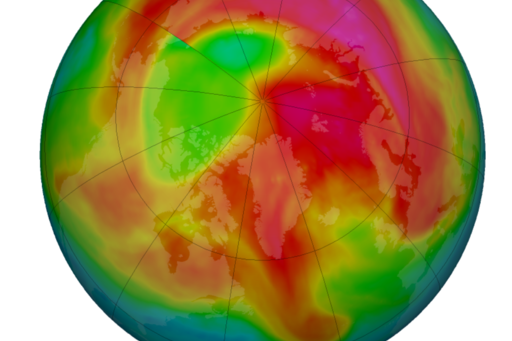
          Arctic ozone - 26 Feb 2018 False-color view of total ozone over the Arctic pole. The purple and blue colors are where there is the least ozone, and the yellows and reds are where there is more ozone. The data is from the Suomi NPP satellite. Copyright: NASA https://ozonewatch.gsfc.nasa.gov


          Featured Educators:

          • Prof. John Burrows


          Optional Further Reading


      • 3f: GHG monitoring and identifying sources

        • When studying carbon dioxide (CO2) in the atmosphere it is important to know where it is now, but it is also vital to know where it came from (sources), where it has been and where it goes to (sinks) in order to understand processes that control the amount of the greenhouse gas in the atmosphere.

          Sources of CO2 are both natural and anthropgenic. Natural sources include animal and plant respiration, the oceans, decomposition of organic matter, forest fires, and emissions from volcanic eruptions. Anthropogenic sources include power generation, transportation, industrial sources, chemical production, petroleum production, and agricultural practices.

          Satellites that currently monitor CO2 include NASA’s Orbiting Carbon Observatory-2 (OCO-2), which takes around 100,000 high-quality measurements each day of carbon dioxide concentrations from around the globe. Sentinel-5p and Sentinel-5 (which will launch in 2021) measure both carbon monoxide and methane. The planned Sentinel-7 mission, will be a Carbonsat-type mission, focusing on anthropogenic carbon dioxide.

          Featured Educators

          • Dr Seppo Hassinen
          • Dr Janne Hakkarainen
          • Dr Mark Parrington


          Optional Further Reading


      • Interactive exercise

        This week’s guided exercise will look at carbon emissions using the Global Carbon Atlas. This tool can be used to explore, display and download data and figures on carbon dioxide emissions from the combustion of fossil fuels, cement production and land use change over multiple decades, including their drivers.

        Task

        1. Visit the Global Carbon Atlas

        2. Read the numbered instructions and click on the ‘Ok, I get it’ button once you are done.

        3. On the left-hand panel click ‘All’ then at the top click on ‘deselect all’. Now in the search box on the left panel search for your country or a country of your choice and tick the box so that only data for that country is showing.

        4. Press the play button on the timeline at the bottom and watch the circle size and amount of MtCO2. Does the amount of carbon decrease or increase from 1960 until 2016? What is the difference? Does it fluctuate a lot of the 50-year period?

        5. Now reselect every country again and play press the play button again. Is the data for the world similar to your country? Or is it the opposite?

        6. You can also look the ‘Focus’, ‘Time series’ or ‘Ranking’ information by clicking on the buttons on the right, and play around with the data. If you find anything interesting or shocking share in the discussion.


    • Week 4: Long Range Pollution Transport


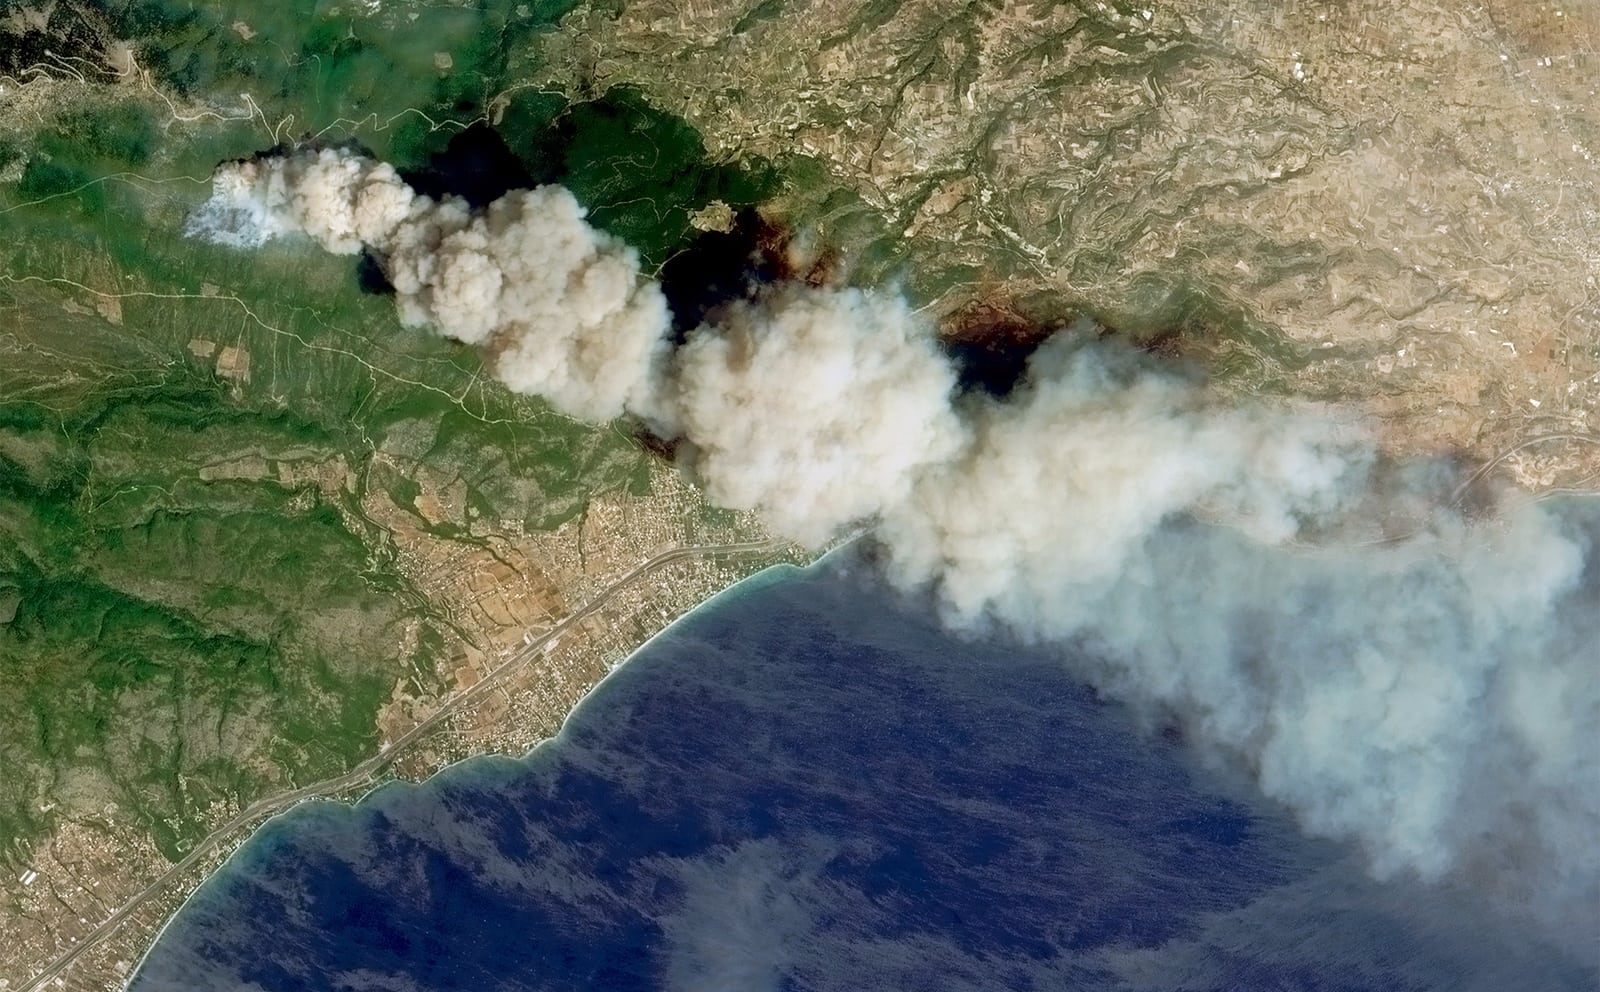
      Week 4 will look at how emissions from natural and anthropogenic sources such as volcanoes, wildfires and dust storms can be transported long distances, and how we can measure and monitor this. 

      We will go over aerosols, how pollution is transported through the air and the sources of these pollutants in more detail. 

      This week will also look at how we can monitor wildfires and biomass burning and using this data to enforce policy, as well as aerosol forecasting.

      • 4a: Overview of Atmospheric transport


        • Transport of pollution in the atmosphere is caused by time-averaged wind flow. How far air pollutants are transported mainly depends upon particle size of the compounds and the height the pollution was emitted into the air. Pollution can travel around a country, or between countries, or even across continents. For example,  a polluted air mass from China travelled to the USA in only 8 days.

          Dust storms and dust transport can have health implications, as diseases can spread around through dust transportation. Outbreaks of material meningitis have been linked to sandstorms and extreme high temperatures in Saharan Africa. Up to 250,000 people, particularly children, contract the disease each year and 25,000 die.

          In 2017 dust from Saharan Africa was transported to the UK due to strong southerly winds. This posed the risk that diseased such as bacterial meningitis can be transported across continents.

          Featured Educators:

          • Prof John Burrows

          • Prof. John Remedios


          Optional Further Reading


          Downloads

      • 4b: Monitoring aerosols with satellite data products & in situ LiDAR


        • In this video, Seppo Hassinen talks us through AC SAF (Atmospheric Composition Satellite Application Facility), which is part of the EUMETSAT Application Ground Segment. SAFs are dedicated centres of excellence for processing satellite data.

          The AC SAF produces a number of near real-time products, including total ozone, tropospheric NO2, and absorbing aerosol index, which indicates the presence of elevated absorbing aerosols in the Earth’s atmosphere. Atmospheric aerosols are a suspension of particles in the atmosphere, which can be either be from man made or natural sources. The aerosol types that are mostly seen are desert dust and aerosols from biomass burning and volcanic eruption events.

          Aerosols can have very negative impacts on society. Particles that are less than 2.5 millionths of a meter (PM2.5) pose a threat to public health, as they can work their way deep into the lungs
          and aggravate or cause breathing problems, particularly for the elderly and the very young. Aerosols can also affect aviation, by reducing visibility and, in situations such as volcanic eruptions, particles can get into jet engines which can lead to total engine failure.

          The Aerosol Robotic Network project – Aeronet, has provided long-term, continuous and readily accessible public domain database of aerosol properties for research and validation. The Aeronet collaboration provides globally distributed observations of spectral aerosol optical depth (AOD), inversion products, and precipitable water in diverse aerosol regimes.

          Featured Educators

          • Dr Seppo Hassinen

          • Dr Bruno Piguet


          Optional Further Reading


          Downloads

        • Tracking the transport and effects of aerosols with satellite data and models


          As you saw in 4b part 1, aerosols can be emitted from natural sources, these include desert dust, volcanic ash and sea salt, or they can be emitted from anthropogenic sources, which include biomass burning, vehicle emissions, and industrial processes.

          Aerosols can range in size from as small as 10 nanometres and up to 100 micrometres. You usually cannot see aerosols easily in the atmosphere, however when in high concentrations, they are easier to spot.

          Featured Educators

          • Dr Rosemary Munro

          • Dr Melanie Ades


          Downloads


      • 4c: Monitoring volcanic emissions


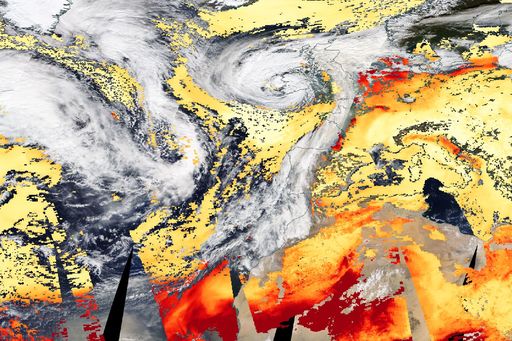
        • Remote sensing can be used to detect carbon dioxide and sulphur dioxide emissions from volcanoes. Measuring emissions from space eliminates the danger to equipment and humans that in situ measurements would face.

          It is important to measure volcanic ash due to its effect on climate and airline transportation. Ash particles can abrade forward-facing surfaces, including windscreens, fuselage surfaces, and compressor fan blades on airplanes, and if sucked into an engine they can melt quickly and accumulate as re-solidified deposits in cooler parts, degrading engine performance even to the point of in-flight compressor stall and loss of thrust power. Ash can also cool the planet by shading incoming solar radiation.

          Satellites are used to track the movement and extent of volcanic ash clouds and to cross-check predictions from numerical models of the spread of the ash. The geostationary Meteosat satellites can detect ash in the atmosphere and play an important role in following its movement and dispersion in European airspace, in near real-time. The Metop satellites with the aid of the IASI, GOME-2 and AVHRR instruments, are able to collect more detailed data about volcanic ash clouds, including sulphur dioxide, ash and ice content, but with less frequency as they only pass over the same area roughly twice a day.
          In the 2021-40 timeframe, the next generations of EUMETSAT’s Meteosat and Metop satellites will provide even more detailed, higher resolution data to monitor volcanic ash and other types of aerosols.

          EUMETSAT’s Meteosat Third Generation (MTG) satellites will be crucial to volcanic ash monitoring with their higher resolution and more frequent imagery and new sounding capabilities. In addition to improved imagery at 10-minute repeat cycles, the provision of data from the MTG infrared and Sentinel-4 ultraviolet/visible sounding missions will be crucial for volcanic ash modelling.


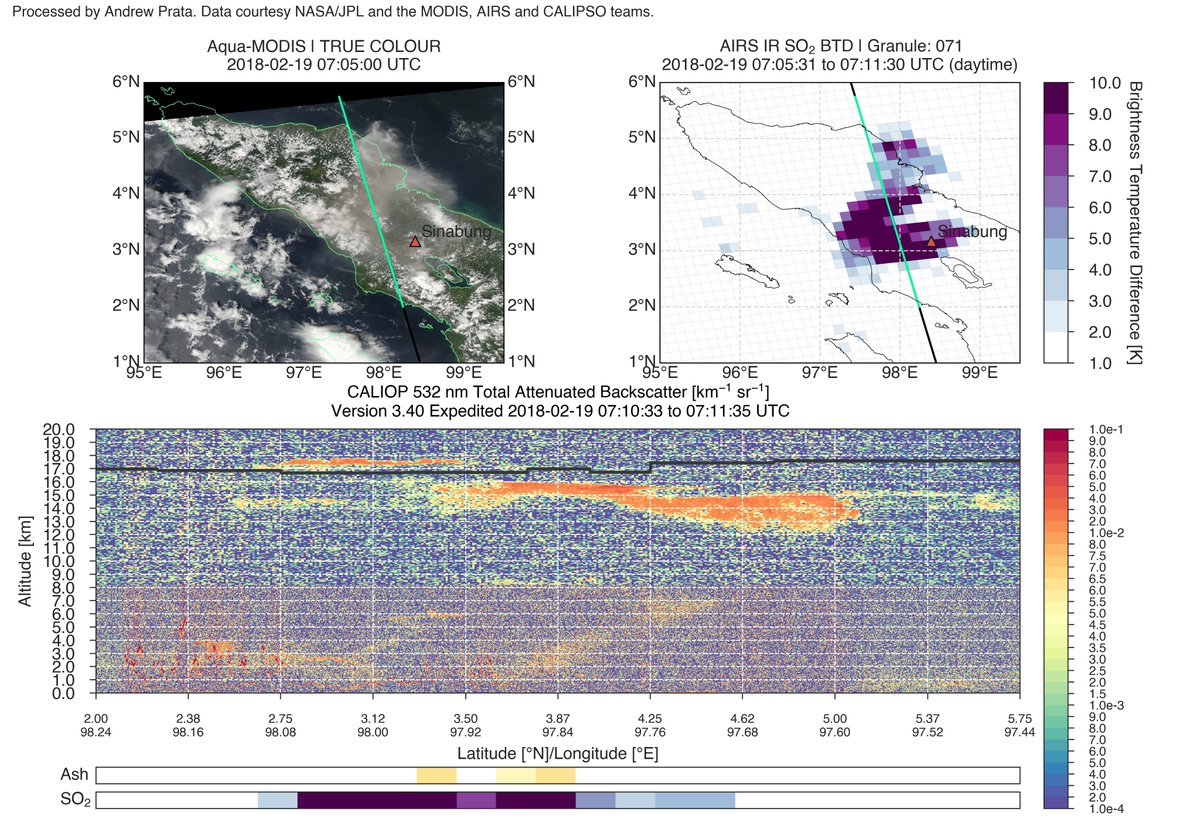
          Sinabung Volcano data products. The image on the top left is a true colour image from MODIS aboard NASA’s Aqua satellite, showing the Sinabung eruption. The image on the top right is the same view but showing the sulphur dioxide in purple. The bottom image is a cross section of the eruption area which shows the ash cloud in red. Copyright: NASA JPL

          Featured Educators

          • Dr Kenneth Holmlund

          • Dr Johannes Flemming


          Optional mini task

          Volcanic ash creates a number of risks; one such risk is to the navigation of aircraft. In the past unexpected encounters with volcanic ash have caused damage to numerous aircraft including in-flight loss of jet engine power, which put the lives of all passengers and crew at risk. Therefore, being able to monitor volcanic ash is essential in being able to ensure safe flying conditions.

          EUMETSAT has created an informative 60-minute training module on volcanic ash. This training module is dedicated to forecasters/aviation forecasters. The main intention is to provide a guideline on how to assess the potential of hazardous weather events such as volcanic ash. Click here to begin the training module.


          Optional Further Reading


          Downloads

        • Case studies & the role of VAACs


          Volcanic Ash Advisory Centres (VAACs) have specialist forecasters who produce volcanic ash advisories and guidance products using a combination of volcano data; satellite-based, ground-based and aircraft observations; weather forecast models and dispersion models.

          There are a number of VAACs around the world including London, which is part of the Met Office, and Toulouse which is part of Météo-France.

          Featured Educator

          • Dr Seppo Hassinen

          • Dr Philippe Hereil

          • Ian Lisk


          Optional Further Reading


          Downloads


      • 4d: Monitoring biomass burning and validating wildfires

        • Fires and biomass burning can be identified from space in real time. The ‘D-Fire’ sub project in the Copernicus programme provides global emissions from biomass burning to the public and MACC (Monitoring Atmospheric Composition & Climate) services using real time and retrospectively from satellite-based observations of open fires.

          Smoke plumes from large wildfires are often visible from space in the visible part of the optical domain, but judging the intensity of a given fire requires a wider range of measurements, such as the temperature of the fire (from the thermal part of the spectrum, at much longer wavelengths than the optical domain, around 10-12 microns), or the area and density of vegetation that is being burnt. Fires convert fuel (vegetation biomass) into atmospheric gases, particularly CO and CO2 as well as other gases and soot particulates. So measuring the loss of canopy can tell us about the release of these gases into the atmosphere, with the potential damage that can do .

          In summer 2017, Canadian wildfire smoke plumes were detected in the Arctic and Greenland, by the VIIRS instrument aboard Suomi NPP. Satellite observations are important to use for monitoring the evolution and impact of wildfires like this one.

          Featured Educators

          • Prof. Martin Wooster

          Optional Further Reading


          Downloads


      • 4e: Monitoring human impact on fires and enforcing policy


        • Wildfires have been getting worse in recent years due to human activity. In California for example, 2017 was at the time the worst season ever for wildfires. There were a recorded 9,133 fires that burned through more than 1 million acres, including five of the 20 most destructive wildland-urban interface fires in the state’s history. The following 2018 wildfire season has now surpassed 2017, with a total of 7,579 fires burning an area of 1,667,855 acres, which at the time, resulted in California experiencing the worst air quality in the world.

          In China, most fires are agricultural fires that are started purposely by humans. These fires release PM 2.5 into the atmosphere which can travel large distances. This has problems for human health and visibility in the effected areas. Data from the VIIRs instrument, as well as ground-based measurements, are used to monitor these emissions, and help guide government policy so they can regulate agricultural fires.

          Featured Educators

          • Tianran Zhang

          Optional Further Reading


          Downloads


      • 4f: Practical Products – Predicting impact from aerosols, dust and fires


        • As you know there are many different sources of pollutants in the atmosphere, these can be from cities, factories, traffic, or shipping for examples, but also natural sources such as dust storms and wildfires. Carbon monoxide from wildfires has a very long photo-chemical lifetime in the atmosphere, which means it can be tracked from the source over towns, countries, or even continents.

          There are products that can be used to predict how dust and aerosols will affect solar energy. For example to help farmers re-orientate their solar panels or to help predict solar radiation levels, for management of solar energy production.

          During Saharan dust outbreaks the photovoltaic output is reduced not only through a significant increase in atmospheric aerosol content by 10 to 20 percent, but also through dust deposition on the photovoltaic modules on subsequent days. This dust can spread to Europe.

          Forecasting products available include EUMETSAT/WMO dust storm products. These get satellite data from the Meteosat satellites SEVIRI instrument and output a RGB composite. SEVIRI can monitor the evolution of dust storms over deserts during both day and night. The RGB combination exploits the difference in emissivity of dust and desert surfaces. In addition, during daytime, it exploits the temperature difference between the hot desert surface and the cooler dust cloud.


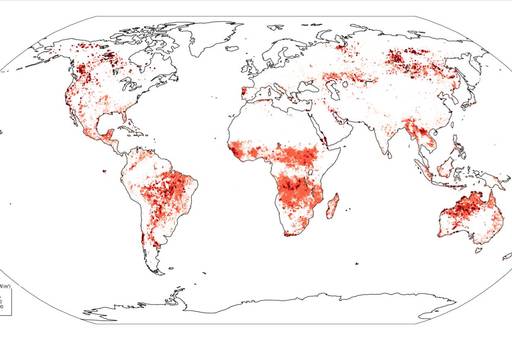
          Global Wildfires. Map of global wildfires in 2017. ECMWF/CAMS


          Featured Educators

          • Dr Mark Parrington


          Optional Further Reading


          Downloads

        • Practical products - Aerosol forecasting


          There are 5 main aerosol species that are used in CAMS aerosol forecasts, these are: sea-salt, desert dust, organic matter, black carbon and sulphates. These forecasts are available daily as total aerosol optical depth (AOD) ), which is a measure of the total amount of aerosol in a vertical column of the atmosphere, or as individual forecasts of each 5 species.

          In this video Dr Melanie Ades shows us 3 different aerosol products, including a forecast during hurricane Ophelia in 2017 that brought desert dust from the Sahara over to Europe.


          Aerosol Optical Depth - Europe. This is an image from MODIS showing aerosol optical depth over Europe on 16th October 2017. The areas in red have high aerosol optical depths. NASA


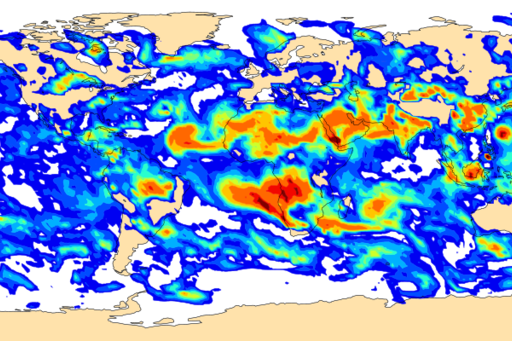
          CAMS Aerosol forecast. This is an example of what a total aerosol optical depth (AOD) forecast from CAMS looks like. CAMS


          Featured Educator

          • Dr Melanie Ades

          Downloads


      • Interactive exercise

        For this week’s guided exercise, we will be using the NASA World View tool. On the 16th October 2017 an orange haze and ‘red sun’ could be experienced in parts of Europe, including the UK and France, due to wildfires in Portugal and Spain, and dust in the Sahara being carried along by winds from Hurricane Ophelia.

        Task

        1. Open NASA World View here.

        2. Go to ‘Add Layers’ and under ‘Hazard and Disaster’ tab choose ‘Dust Storms’, then ‘Aerosol Optical Depth’. On the left-hand side choose ‘Suomi NPP/OMPS’, then tick the box for ‘Aerosol Index’. Once you have done this, close the pop-up box by clicking the x.

        3. Select the date at the bottom as October 15th, 2017, can you see where the high amounts of Aerosols are (shown in bright yellow and red). Now move the date to the 16th through to the 18th and focus on Europe. Can you see the movement of aerosols?

        4. You can also go to ‘Fires’ and then ‘Fires and Thermal Anomalies’ to add a layer on showing active fires. You will now be able to spot the source more easily, of the aerosols that were coming from the wildfires in Portugal and Spain.

        5. Can you spot any other similar events to this? Such as the red haze in Crete, Greece on 22nd March 2018.


    • Week 5: Open data and emerging data services


      In this final week of the course we will take a look at Copernicus missions and strategies for the future, and round up the course.

      We will look into the free and open data provided by Copernicus and how we can benefit from this data. This week will also cover how earth observation data supports effective international policy and decision making for climate change mitigation and adaptation.


      • 5a: Future Innovations - Open data and emerging data services


        • Welcome to the final week of the course!

          Copernicus provides free and open access to its data products including CAMS.

          Due to the extremely large amount of data that is available and will be available in the future, DIAS (Data Information and Access Service) are being set up to allow easier access to users. The WEkEO Copernicus DIAS is a new data service that is provided by EUMETSAT, Mercator Ocean, and the ECMWF. It was launched in June 2018 and enables users to discover, search and access Copernicus data for free including all data from Sentinel satellites, contributing missions and the Copernicus marine, land, atmosphere and climate services.

          When all Sentinel satellites are in operation they will deliver in excess of 10 petabytes of data each year. Information from the Copernicus services, derived from the Sentinels, other satellite data as well as information from the Copernicus in-situ component, add to the total amount of geospatial data generated or made available by the Copernicus programme.

          Data from Copernicus is used by service providers, public authorities and other international organisations to improve the quality of life for the citizens of Europe.

          Featured Educator

          • Dr Mauro Facchini

          • Prof. John Remedios

          • Dr Martin Adams

          • Dr Mark Higgins


          Downloads

        • Future Copernicus missions and strategies


          It has been over 20 years since the Baveno Manifesto, of which gave rise to the Copernicus programme, was signed on 19th May 1998. There are now 7 Sentinel satellites in orbit and still many more to come. The Copernicus programme is the biggest provider of Earth observation data in the world.

          The next three Sentinel missions are currently being built (Sentinel-4, Sentinel-5 and Sentinel-6) and there are another six mission concepts being assessed. Sentinel-4 and Sentinel-5 will be launched in 2023 and 2021 respectively, by EUMETSAT, and Sentinel-6A is expected to launch in 2020 on a Space-X Falcon 9 through a launch contract with NASA.

          The Copernicus future space strategy was adopted in 2016 and gives two priorities going ahead - continuation and evolution. Continuity is needed for long term predictability and planning certainty to all stakeholders involved. In addition, the future evolution of Copernicus aims to be based on evolving user requirements. It recognises the emergence of new user communities of a non-space background, who require access to data, information and products in a timely and user-friendly manner.

          Featured Educators

          • Dr Mauro Facchini

          • Prof. John Remedios


          Downloads

        • Future satellite missions in depth


          This video looks at future satellite missions and innovations in more depth, including Meteosat Third Generation.


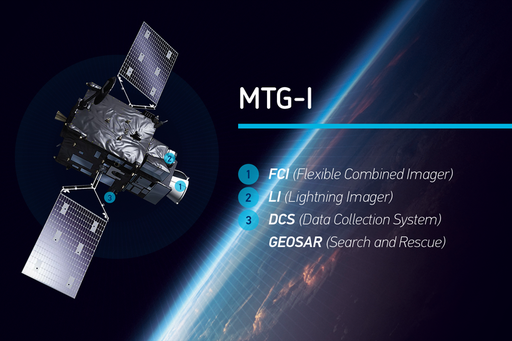
          MTG-I. Meteosat Third Generation (MTG) is EUMETSAT’s next generation of geostationary satellites, following on from earlier successful missions. This next generation, following on from Meteosat Second Generation, will provide an evolution of the imaging service, including a new Lightning Imager, on MTG-I, and a state-of-the-art atmospheric sounding service providing measurements in the infrared and ultraviolet spectrum. The sounding satellites, MTG-S, will also carry the Sentinel-4 instrument. EUMETSAT


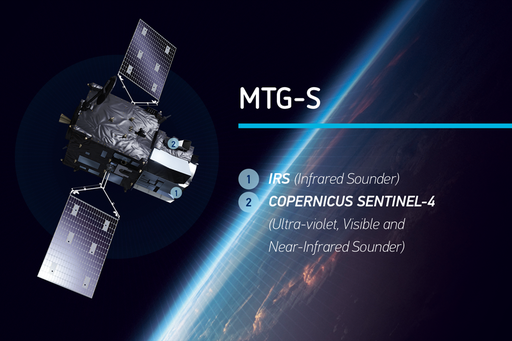
          MTG-S. Meteosat Third Generation (MTG) is EUMETSAT’s next generation of geostationary satellites, following on from earlier successful missions. This next generation, following on from Meteosat Second Generation, will provide an evolution of the imaging service, including a new Lightning Imager, on MTG-I, and a state-of-the-art atmospheric sounding service providing measurements in the infrared and ultraviolet spectrum. The sounding satellites, MTG-S, will also carry the Sentinel-4 instrument. MTG will see the launch of six new geostationary (imaging and sounding) satellites from 2022 onwards. EUMETSAT

          Featured educators

          • Dr Vincent-Henri Peuch

          • Dr Kenneth Holmlund

          • Dr Mauro Facchini


          Downloads


      • 5b: International climate change policy, ECVs and UN COP

        • Earth observation data supports effective policy and decision making for climate change mitigation and adaptation.

          The Copernicus Earth Observation programme and its six services provide valuable tools, data and opportunities for policy-makers, businesses and scientists for the UN-COP conferences, not least from the Atmosphere Monitoring Service and Climate Change Service managed by ECMWF.

          Copernicus Atmosphere Monitoring Service contributed to COP21 in 2015, when the Paris Agreement on a global reduction to climate change was negotiated, as well as the most recent COP23 in 2017, providing essential monitoring data about atmosphere to support the treaty negotiation and, in future, to support governments to meet their obligations. The ECMWF-run Copernicus Climate Change (C3S) and Atmosphere Monitoring Services (CAMS), joined the European Commission at COP-23, and participated in 4 side events including the ‘Global monitoring of greenhouse gases for a better understanding of our climate’ event.

          Earth Observation has also supported the needs of the climate change community though the Essential Climate Variables (ECV), of which EO provides data for. There are 50 ECVs defined in 2010 split into 3 domains, one of which is Atmosphere.

          Featured Educators

          • Dr Kenneth Holmlund

          • Dr Richard Engelen


          Optional Further Reading


          Downloads

      • 5c: Final course round-up

        • We have now come to the end of ‘Monitoring Atmospheric Composition From Space and the Ground’, congratulations on completing the course and thank you for your participation over the last five weeks.

          We hope you have enjoyed this course, and gained a useful insight into the science, techniques and applications, as well as the steps involved in going from observations to forecasting and releasing data the public, of using Earth Observation and in situ measurements to monitor the atmosphere, and its vital importance to life on Earth. We hope that this will help you in your further work, interests and decisions, and we wish you the very best for the future.

          We also have three bonus videos which are practical guides in Topic 5d, 5e and 5f. These cover Meteosat Third Generation, how you can download atmospheric images and data, and an in depth guide on how you can visualise data using NetCDF.

          Featured Educators

          • Dr Rosemary Munro

          • Dr Mark Parrington


          Downloads

      • 5d: Practical guides