Downward shortwave radiation data

Downward shortwave radiation data

by Theodoros Gkousarov -
Number of replies: 26

Hi,

My name is Theo and I m doing a research on verification of the Downward shortwave radiation observation data from satellites compared to the ECMWF deterministic model output.

The question is : Where can I find the satellite data for the Downward shortwave radiation so that i can visualize them using McidasV ?

is there any ftp server providing these data as I currently dont have Eumetcast receiving station.

Thank you very much.

In reply to Theodoros Gkousarov

Re: Downward shortwave radiation data

by Rebekka Posselt -

Hi Theo,

thanks for the interes in the surface radiation data.

You can download the data from the CM SAF Web-User-Interface (http://wui.cmsaf.eu). A tutorial on how to use the interface for ordering data you find on the course page in Topic 1 (direct link: https://classroom.eumetsat.int/mod/page/view.php?id=6505). The data is available in NetCDF and HDF5 which you should be able to import into McIDAS-V (at least NetCDF works as far as I know).

Kind regards,

Rebekka

In reply to Theodoros Gkousarov

Re: Downward shortwave radiation data

by Jörg Trentmann -

Dear Theo,

thanks for sharing your project on validation of the ECMWF model output of the surface solar irradiance.

In fact, there are already attempts to use the CM SAF surface radiation products to evaluate the performance of the ECMWF model. Enclosed please find a comparison of the monthly mean surface solar irradiation from CM SAF and the ECMWF forecast model for July 2011. The two upper panels show the (left) ECMWF and (right) CM SAF data, the two lower panels show the (left) absolute and (right) relative differences.

Overall we were very happy with the good performance of the model and the suitability of the satellite data for model evaluation. The differences in the desert region in Northern Africa are likely related to problems in the satellite retrieval and not due to shortcomings in the ECMWF model. Other features seen in these analysis point to known shortcomings of the representation of clouds and aerosols in the ECMWF model, i.e., the overestimation in the stratocumulus region in the Atlantic and the underestimation in the Gulf of Aden. For Europe, the model seems to slightly overestimate surface irradiance at least on the monthly average for July 2011.

The ECMWF is currently evaluating the use of the CM SAF data for their operational model evaluation, you might want to contact Thomas Haiden (thomas.haiden@ecmwf.int) for more information. However, since the ECMWF is obviously focusing on the overall model performance, additional studies (e.g., regional) can surely complement their effort. Do you intent to have a more specific focus, e.g., a regional focus?

Please let us know if you experience any problems accessing the data. Alternatively to using McidasV you might want to consider using cdo and R for your analysis. It would be great if you could keep us updated on your project and the results! 

Kind regards,
Jörg

Attachment Evaluation_ECMWF-CMSAF_201107.png
In reply to Jörg Trentmann

Re: Downward shortwave radiation data

by Theodoros Gkousarov -

Thank you very much for your quick and detailed responce :).

I downloaded the data from the WUI in netcdf format, however I have difficulty opening them with McidasV and looks like I m doing something wrong while trying to open the files using IDL. Panoply from NASA managed to display the Data though.. I am using SIS and TRS data.

I was wondering if the .nc.gz in the end of the filenames mean that the files are compressed (GZ). I am not an experienced user so excuse me :). 

Jorg:  I am trying to do some verification using the satellite data for obs compared to the forecast output of the low resolution ECMWF model (32km)EPS for southern UK in particular. I am aware of the verifications that have been done so far and the ongoing, however want to do it as well. I will keep you updated here .

Thank you very much,

Theo Gkousarov

I

In reply to Theodoros Gkousarov

Re: Downward shortwave radiation data

by Christine Träger-Chatterjee -

Dear Theo,

although I am not familiar with McidasV I suppose the problems are due to the file compression: Yes, you are right, the ".gz" means that the files are compresses (".nc" is the ending of files in netcdf format). I expect that uncompressing the files will solve your problem.

If you have any further questions - please keep contacting us, we will try to help wherever possible.

Kind regards,

Christine


In reply to Theodoros Gkousarov

Re: Downward shortwave radiation data

by Jörg Trentmann -

Dear Theo,

sounds good! It is always useful to have independent verification studies so I am curious to see your results (and the people at ECMWF might also be interested)!

Regards,
Jörg

In reply to Jörg Trentmann

Re: Downward shortwave radiation data

by Theodoros Gkousarov -

I finally managed to use R and CDO to plot timeseries using SIS data. No have to buy a hard disk to accomodate 500gb of data ;).

I will have to extract the SIS data from their .nc.gz and make them .nc then I will use CDO to merge the files into one .nc and then play with CDO and R. 

Thank you very much for your help, I ll keep you informed if i encounter any difficulty and will let you know about the results.

It is a great opportunity for the simple user to have the ability of accessing data and software as well as geting support on his research. Eumetsat and the Centres of Excellence definitely made a great job on forwarding the knowledge to the wider community.


With regards,

Theo.

In reply to Theodoros Gkousarov

Re: Downward shortwave radiation data

by Theodoros Gkousarov -

Getting back to this section of the forum once again ;)

I m in the stage where:

I have selected 3 weather stations recording solar radiation across UK, the data are in the following format : DATE, TIME, Value (KJ/m2) so 3 columns in a xls file for 1 month period.

I also have the SIS dataset from WUI CMSAF for the same period.

What I want to do now is :

Combine time steps using CDO, extract 3 different locations using CDO, ( this I know now how to do it),

But I dont know how to compare the station data against the satellite data for each of the 3 locations. So basically I need to know how to plot 2 different curves in one plot.

What do i need to do in order to use the .xls file that contains the data to plot on the same chart?

And then, How can i plot-create an image showing the total SIS across one region over a specific time-period?


Thank you very much.

In reply to Theodoros Gkousarov

Re: Downward shortwave radiation data

by Jörg Trentmann -

Hi Theo,

there are multiple options to compare the station data with the CM SAF data.
Possibly the easiest solution for you at this stage would be to convert the CM SAF data from netcdf-format into an Excel-format and do the analysis in Excel (assuming you are more experienced in Exel than I am). Exporting the CM SAF data can be accomplished using the script '05_export.TimeSeries.R'.

To import an Exel file into R you might want to have a look here:
http://cran.r-project.org/doc/manuals/R-data.html#Reading-Excel-spreadsheets
The data has to be read into a R variable and can be plotted ontop of an existing plot using the 'lines'-command, check out the help page using '?lines' at the R-prompt.

To plot the spatial distribution of SIS, e.g., one monthly mean, you can use the 10_plot.Region-script, which allows to select the time and the region.

Hope this helps! We are looking forward to see the results of your evalution of the CM SAF data!

Kind regards, Jörg

In reply to Jörg Trentmann

Re: Downward shortwave radiation data

by Theodoros Gkousarov -

Hi Jorg,


Indeed I managed to export the timeseries in a xls format and then made the comparison with the station data. I posted the results in the forum.


However I have some difficulty plotting the total SIS over a specific period using the 10plotregion script .

I am attaching my modified script and the text file with the error messages from the R.

Can you find where im doing wrong?

I want to plot the total SIS over the period of 10thjune 2011 to 21july 2011. Mainly interested for UK.


Thanks.


Error in if (lat[ny] < lat[1]) { : argument is of length zero
>
> # calulate the mean, min, max for the selected region only
>   lon.reg <- which(lon >= lonmin & lon <= lonmax)
>   lat.reg <- which(lat >= latmin & lat <= latmax)
>   z.reg <- z[lon.reg,lat.reg]
Error in z[lon.reg, lat.reg] : incorrect number of dimensions

In reply to Theodoros Gkousarov

Re: Downward shortwave radiation data

by Jörg Trentmann -

Hi Theo,

what kind of input file are you using with this script? This script is intended to work with an input file that contains multiple time steps of monthly means from CM SAF data on a lon-lat grid. You can select the time step you want to display in the script (variable 'year' and 'month'). To select a certain day, this script would need to be extended, which should not be to difficult.

The first thing to diagnose what is happening would be to check the dimensions of the input data. This can be done by typing 'nc' (i.e., nc is the R-variable that contains the information from the file) at the R-prompt after running the script.

Maybe you can post the outcome of this here, this would help the further diagnosis of your problem. If possible (i.e. in the case it is not too big), you could also attach the file 'comb.nc' you want to display.

Kind regards,
Jörg

In reply to Jörg Trentmann

Re: Downward shortwave radiation data

by Theodoros Gkousarov -

I am using the same input file as I used for ploting the timesteps with R.

now as you say it is intended for input file contanining multiple time steps of monthly means, then I m not quite sure if it fits my purpose.

I want to show the spatial distribution of the total SIS over a period of 10june-21july in KJ/m2 across UK. so I want to create a map showing during this period which areas got the most and how much that was.

the comb.nc is 200mb unfortunately to be uploaded, but i created it using the .nc files (42 files) which coresspond to the operational data from the period under investigation using CDO combine timesteps.

I typed nc and i m attahing the results below.


> nc
[1] "file D:/CMSAF_V2/Data//datasets/SIS/comb.nc has 3 dimensions:"
[1] "x   Size: 1185"
[1] "y   Size: 1185"
[1] "time   Size: 42"
[1] "------------------------"
[1] "file D:/CMSAF_V2/Data//datasets/SIS/comb.nc has 2 variables:"
[1] "char sinusoidal[]  Longname:sinusoidal Missval:NA"
[1] "float Data1[x,y,time]  Longname:Data1 Missval:1e+30"
>

In reply to Theodoros Gkousarov

Re: Downward shortwave radiation data

by Jörg Trentmann -

Theo,

it seems the files you have ordered from the CM SAF Web User Interface are on the original sinusoidal projection. This is the official projection on which the CM SAF operational products are provided. However, data on such grids are not straight forward to display and the provided R script is designed to operate on CM SAF data on a regular lon-lat grid.

To obtain the data on a regular lon-lat grid, I suggest that you repeat your data order from the CM SAF WUI and use the option to order the data on a regular lon-lat grid. You might also want to select a certain region, e.g., Europe, to reduce the data amount. As a grid point distance I suggest to use 0.2 x 0.2 deg, which roughly corresponds the to 15 x 15 km of the sinusoidal grid.

For the instructions how to order the CM SAF data on the regular lon-lat-grid, have a look at the screencasts:
https://classroom.eumetsat.int/mod/page/view.php?id=6505
The second screencast, roughly after 3 min, introduces this option.

Hope this help, looking forward to see the surface irradiance over the British Isles,
Jörg

P.S. To plot daily mean from selected days using the script 10_plot.Region, add the variable day to the script, e.g. after the definition of the year and month variable in line 38:
day <- 23
and 
adjust the setting of the timeout variable (line 233) to include the day-variable:
timeout <- as.Date(paste(year,"-",month,"-",day,sep=""))

In reply to Jörg Trentmann

Re: Downward shortwave radiation data

by Theodoros Gkousarov -

I downloaded the data using the instructions.


The extraction of your ordered CM SAF products (SIS from MSG1, Daily, Mean, Version 210, Sinusoidal projection (15x15 km2), CM SAF baseline area (30N-80N, 60W-60E), NetCDF:LatLon,-11.12,61.71,3.

31,48.46,0.02,0.02, 10.06.2006 - 21.07.2006) from our database system has been finished successfully.
( the title stil appears to be the sinusoidal projection :/)

run the CDO for combine time steps ( output name 2006.nc) and then tried to run the plot with R. it still didnt work. I typed the cmd nc in R and this is the result

> nc
[1] "file D:/CMSAF_V2/Data//datasets/SIS/2006.nc has 3 dimensions:"
[1] "lon   Size: 723"
[1] "lat   Size: 664"
[1] "time   Size: 42"
[1] "------------------------"
[1] "file D:/CMSAF_V2/Data//datasets/SIS/2006.nc has 1 variables:"
[1] "float Data1[lon,lat,time]  Longname:Data1 Missval:1e+30"

Cant figure out whats going wrong.

dataset file attached..

In reply to Theodoros Gkousarov

Re: Downward shortwave radiation data

by Jörg Trentmann -

Hi Theo,

thanks for providing the sample data, it looks ok!

Are you getting the same error message as before? If this is not the case, the problem might be related the selection of the date to be plotted. In the script you have to specify the date you want to plot by setting the variables 'year' and 'month'. By default it selects the first day of the selected month (see my previous post on updating the script for plotting of specified daily data). In the data you provided there is only the first of June and July 2006 included so the variables in the script have to be adjusted accordingly. Otherwise you should get an error message saying
"Selected time not included in the file!"

Please check your settings of year and month in the script, if this does not work, please post your script here as well and I will have a look.

Hope this helps, cheers,
Jörg

In reply to Jörg Trentmann

Re: Downward shortwave radiation data

by Theodoros Gkousarov -

Well i think it would be much easier if somebody that has run this script and it worked could upload it here so that i could modify and run it. I m uploading the script Jorg so that you can take a look.

one of the errors is this


Error in get.var.ncdf(nc, varname, start = c(1, 1, itime), count = c(nx,  :
  Error: variable has 3 dims, but start has 2 entries.  They must match!

I am attaching the script which i m using to plot with the 2006 data.

In reply to Theodoros Gkousarov

Re: Downward shortwave radiation data

by Jörg Trentmann -

Hi Theo,

the script works fine for me, see below.

The only adjustmen that might be required on your side is to adjust the beginning of the script:


# Select from the List of Products/DataSets
# (Information required to generate the name of the directory)
product <- "SIS"
# type = Products or DataSets
# (Information required to generate the name of the directory)
type <- "DataSets"

This part looks a bit modified in the script you provided, which could lead to problems opening the file you want to display. When checking the file in R using 'nc' you might get the information on the last file that was successfully opened. To prevent this you can exit R, reenter and run the script as the first thing. Then have a look at the first error message that is occuring.

Also I adjusted the region to be plotted, because the data file contains only data between 0 and 10 W and 50 to 60 N, so the lon coordinates in the script must read:
# select the plot region
lonmin <- -10
lonmax <- 0

Hope this help and look forward to seeing your first plot of the daily mean surface radiation over England!

Cheers, Jörg

Attachment plot.png
In reply to Jörg Trentmann

Re: Downward shortwave radiation data

by Theodoros Gkousarov -

YES Jorg, It works.

Thanks so much :). Now I can continue with the rest., i WILL post the results as soon as i finish the whole project, so it may take a few days.

In reply to Theodoros Gkousarov

Re: Downward shortwave radiation data

by Theodoros Gkousarov -

I actually need the script which will visualize the total accumulated SIS over a specific period, in this case from 10th june 2011 until 21st july 2011. so its 42 days and i want a map with the total accumulated values. so in other words the sum of all daily totals.

The script that we been discussing previously is visualizing only the daily mean of a specific day.


Thanks.

In reply to Theodoros Gkousarov

Re: Downward shortwave radiation data

by Jörg Trentmann -

You can add up the values of all time steps in the netcdf-file using the 'timsum' command of cdo (by using the 03_CalculateStatistics.bat script) and plot the resulting data using the R-script. See the cdo-manual for further information, page 93 in the pdf-version of the manual for Version 1.5.2.

I am, however, not so sure on the unit of the result, since the CM SAF data originally comes in W/m2. Don't know how to interpret the sum of the daily means in W/m2, can you just use the same conversion factor to derive kJ/m2?

Cheers, Jörg


In reply to Jörg Trentmann

Re: Downward shortwave radiation data

by Theodoros Gkousarov -

I used CDO and created a .nc file with the total accumulated values.

I managed to change the  units

unit <- "kj/m2

but couldnt figure out where exactly to add the 2 lines for the conversion. i am attaching you the current one but it doesnt work.

# Read in the data
    if (product == "HLW" || product =="HSH") {

        field <- get.var.ncdf(nc, varname,start=c(1,1,level,itime),count=c(nx,ny,1,1))
        conversion.factor <- 60. * 60. * 24. / 1000.
            field <- field * conversion.factor
           na.ind <- which(field < 0.)
        field[na.ind] <- NA
        } else {
        field <- get.var.ncdf(nc, varname,start=c(1,1,itime),count=c(nx,ny,1))    
    }
# Set the missing data to NA

should it be in that location or more below?

In reply to Theodoros Gkousarov

Re: Downward shortwave radiation data

by Jörg Trentmann -

Sounds good.
The conversion factor should be placed slightly lower. As it is now it is only applied for the HLW and the HSH product (see the if-clause above). The best location of the conversion would be after the netcdf-file has been closed (around line 255). When you add these two line after
close.ncdf(nc)
it should work out fine, at least technically....

Regards, Jörg 


In reply to Jörg Trentmann

Re: Downward shortwave radiation data

by Theodoros Gkousarov -

I tried every possible solution during the weekend, however the result doesnt seem to be the one i m looking  for.

So to sum up... I have a dataset of 42 timesteps for the period of june10th until 21st july 2011. I combine all the timesteps using the CDO and create a file with name 2011new.nc

then I m using the 03calculate statistics cdo script, using the timsum function and create the 2011sum.nc file ( assuming it combined all the time steps, but still in w/m2 and not the kj/m2)

Then I m runing script 10plottimesteps and puting the conversion factor here

# this has also to be considered for the FillValue
  na.ind <- which(field==(missval*scale.factor + offset.value))
  field[na.ind] <- NA
 close.ncdf(nc)     

conversion.factor <- 60. * 60. * 24. / 1000.
field <- field * conversion.factor

 close.ncdf(nc)

# format the time step for plotting
if (nt > 1) {

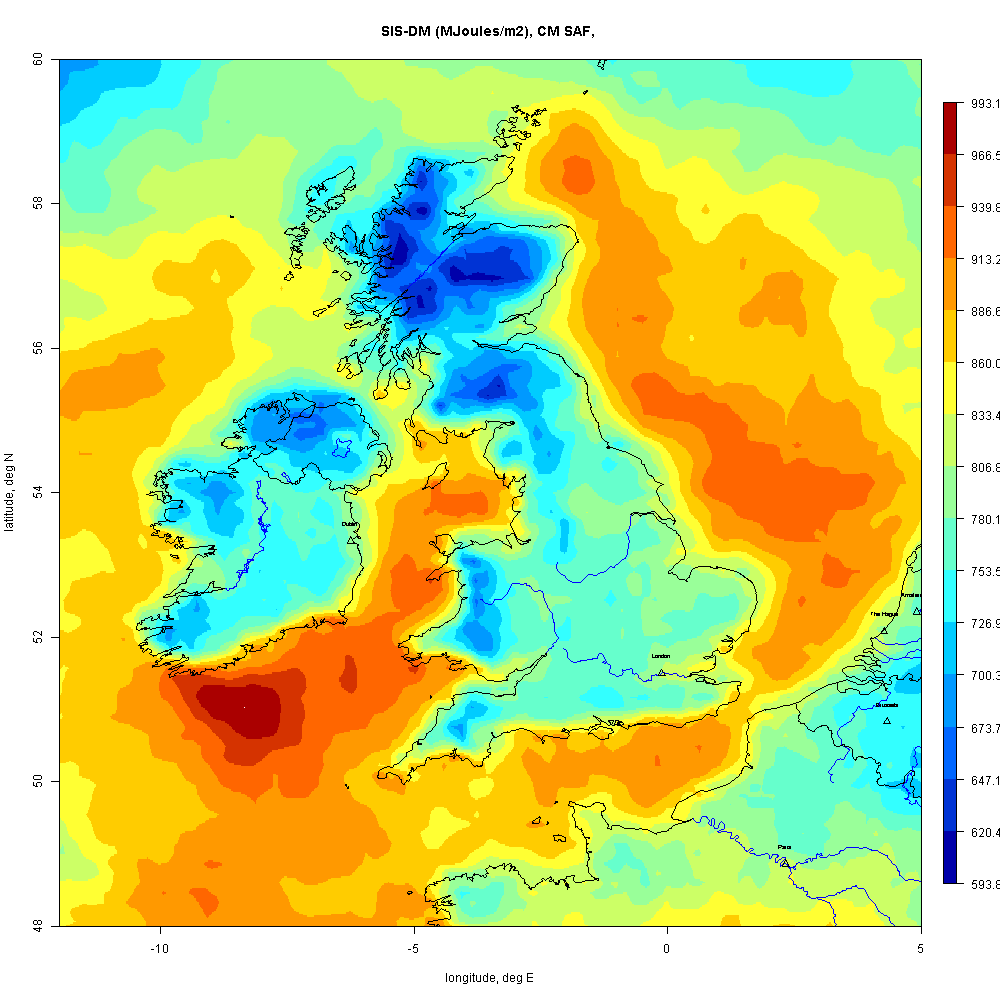
So I assume that the 2011sum file with values in w/m2 has now converted into a kj/m2 and plotted. But the map doesnt look reasonable :(

first of all the scale looks inverted, and then the values are quite low


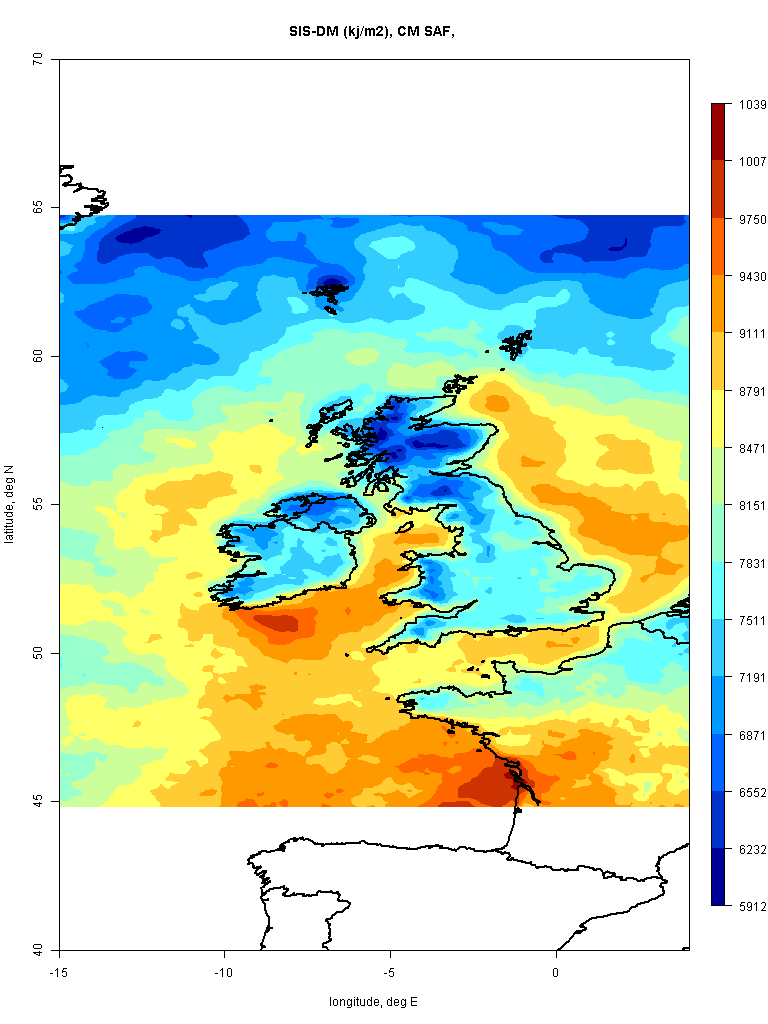
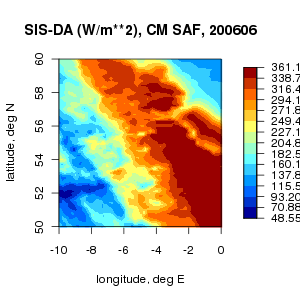
without using the timsum command the result looks like this below----->

I think the problem maybe coming from this script because it determines only one specific period and not all the 42day period


# In case you want to add something to the title of the plot
add2title <- "CM SAF, "

# for files with multiple times: select the time
# Make sure that the selected time is available in the data file
year <- 2011
month <- 7
day <- 16


# select the plot region
lonmin <- -15
lonmax <- 4
latmin <- 40
latmax <- 70


Thank you very much , Looking forward for some news.


In reply to Theodoros Gkousarov

Re: Downward shortwave radiation data

by Jörg Trentmann -

Hi Theo,

thanks for these figures!

Yes, I see your point with the color bar. However, the problem might be related to the available space for the plotting of the label of the color bar. The width of the plot seems to be limited so that only 4 digits can be placed next to the color bar. You can adjust the width of the plot using the width-parameter in the 10_plot.Region-script (around line 47). Alternatively you might want to plot the accumulated sum in MJ/m2 instead of kJ/m2, which also reduces the required number of digits of the color bar.

Maybe you can check whether this might increase the readability of the colar bar.

The spatial distribution of the accumulated solar radiation suggests that there is, on average, a substantial land-sea contrast with more clouds over land than over the ocean. To me this does not seem to unrealistic in general, at least during summer.

Kind regards,
Jörg

In reply to Jörg Trentmann

Re: Downward shortwave radiation data

by Theodoros Gkousarov -

Wonderful,

Here is the result, I am attaching a map showing the total solar radiation across UK for the period of June 10th 2011 until July 21st 2011. We can observe that:

1) Due to the convection over the land, the total amount of solar radiation reaching the ground is far less than of the one over the Sea.

2) The predominant synoptic situation could well be an anticyclonic pattern over the mid Atlantic driving northwesterly winds across much of the British isles, or a low pressure over the North Sea bringing again northwesterlies across western parts. This can be confirmed by the fact that western Scotland and Northern Ireland are showing low radiation as the result of the down-wind, while south of Ireland showing quite high amounts of solar raddiation as a result of a lee-ward wind.

You were right about the color bar, making it into mjoules instead of kjoules it fixed it, however it still seems sligtly trimmed in the right.


Thank you very much for the great help, However as my curiocity bounds no limits and I| will want to come across new results and new outcomes I think I may need your help quite soon again.


Thank you,

Theo

In reply to Theodoros Gkousarov

Re: Downward shortwave radiation data

by Jörg Trentmann -

Thanks for this beautiful figure!

I am always fascinating on the spatial structure one can observe in such images: Here I just noticed the slight maximum along the River Themes just west of London... It would be great to have some surface records to evaluate these satellite-derived data.

Regarding the color bar you might want to manually adjust the breaks so that no decimal digitis are shown. set.col.breaks (line 54) controls the manual setting of the color bar ticks, which are specified in the variable brk.set. You either list each break individually or create a sequence (see ?seq) of color breaks.

Have fun playing with the data and keep us updated!

Regards,
Jörg

P.S. Starting tomorrow I will be on travel, so I will not be able to respond as regular to your posts...

In reply to Jörg Trentmann

Re: Downward shortwave radiation data

by Theodoros Gkousarov -

Yes I will play more with the SIS data and make some verifications using bsrn data.

later this month i will start playing with the cloud data. I want to make maps showing the spatial distribution of cloud free days across Europe.

Have a nice holidays Jorg and catch up later in august. I am also off for 20 days next week.

Cheers.