Hi All,
Today I downloaded the newest version of SIS (340) daily means for the first 6 days of June 2013. I compared the accumulations over these 6 days ( in converted to MJ/m2) against the total surface radiation observations from 8 stations over the UK, (Met Office netowork).
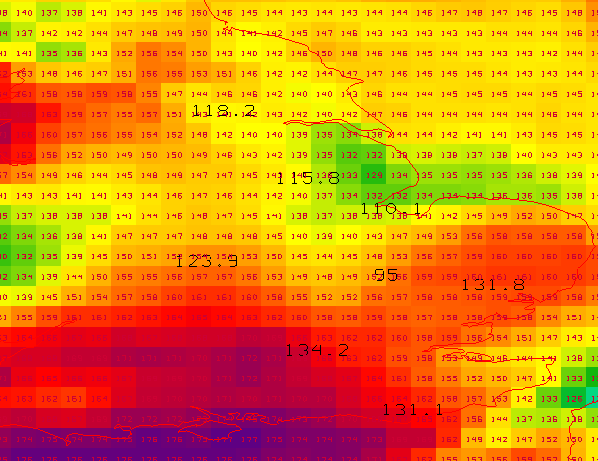
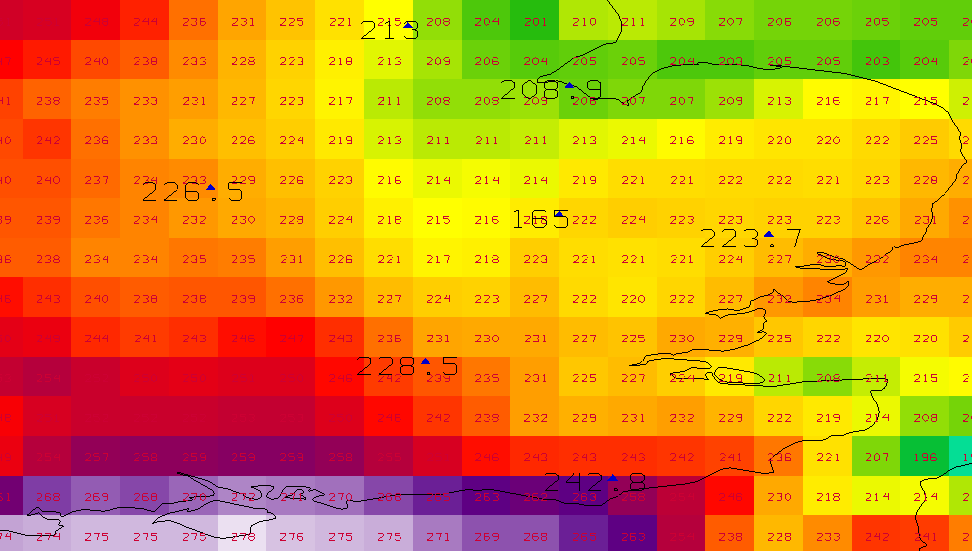
Figure 1. Total SIS accumulations 01-06June (0.2 degrees resolution)red fonts, station totals for the same period black bigger fonts.
We can easily observe an overestimation of SIS by at least 10%. I know that the period is very sort to gain any conclusions and also the station observations are site-spesific while the satellite estimate is averaged over the whole grid square, but would like to see some results here if possible from your verifications.
This results are preliminary and I will wait at least to have the whole months of June to run a more thorough analysis.
Kind regards,
Theo