Hi, Aissa,
this is a good topic, and relevant for your latitudes. Lots of good material is available on using WV images or Airmass RGB images together with NWP Potential Vorticity maps. I can recommend the COMET lesson "
Assessing NWP with Water Vapour Imagery" . There is also a nice
Webinar by Bryan Guarente based on this module with some nice visualisations to help us understand the Water Vapour imagery.
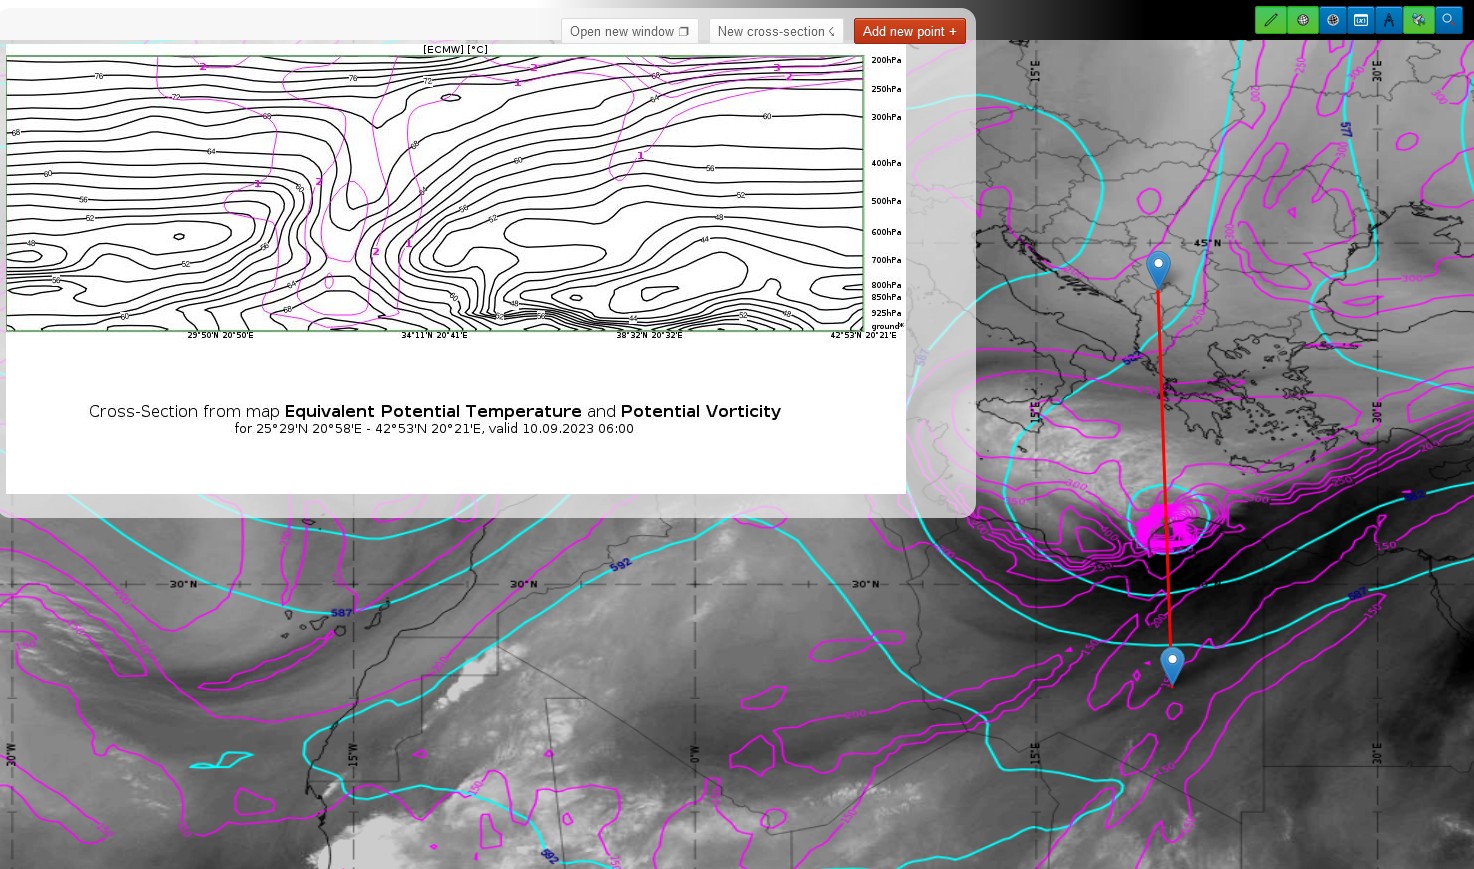
I attach one case from 10 September 2023 catastrophic case, storm Daniel over Northern Africa (Libya). In the picture, you can see the deep dry (dark) tones in water vapour imagery, within with very high values of PV. The vertical cross-section , that
ePort allows us to use, shows that high PV penetrating to exceptionally low altitudes within the troposphere.
You can try these visualizations yourself to see how NWP PV and Satellite WV can be used in an integrated manner.
Vesa